
In part one of this series we reviewed the basic composition of the Vanguard Health Care Mutual Fund (ticker VGHAX) using Morningstar’s website. In this article, we will look at details related to the fundamentals of the fund as well as performance of the fund relative to benchmarks.
Before moving on, I wanted to highlight one page that contains useful information about the stocks held by the fund. If you go to the following page we see that the fund is comprised of 82 stocks. The top ten stocks make up roughly 39% of the portfolio. The top five stocks in this fund are: Bristol-Myers Squibb, Allergan, UnitedHealth Group, Merck and Eli Lilly. According to Vanguard’s site, the fund is weighted 45% pharmaceuticals and this is observable directly in the top holdings. Interestingly, the fund is weighted 15% in the biotechnology sector.
Fundamentals
Next I’d like to discuss the fundamentals of the portfolio. When we talk about a stock, the ‘fundamentals’ refers to the underlying financial details of the company. ‘Fundamentals’ is a broad term and could cover a wide range of financial elements such as revenue, earnings, cash flow, expenses, debt and so on. Generally, when we evaluate the value of stocks on fundamentals, we are talking about the price we think the company is worth based on its financial history and outlook. We can also value a company in comparison to its industry peers, or a benchmark. Interestingly, not only can we evaluation a stock based on fundamentals, we can also do the same for a mutual fund by looking at the composite fundamentals of the aggregate of all stocks within the fund.
To begin, let’s look at the Value and Growth Measures found at this here. The default benchmark for comparison in this case is the S&P 1500 Healthcare TR. This index is based on 1500 US healthcare stocks.
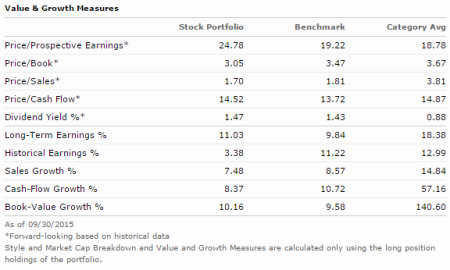
Let’s look at a few measures for discussion. First note the price to prospective earnings. This number uses the current stock price and projected earnings for the companies. We can see that the portfolio has price/prospective earnings of 24.8 while the benchmark and average fund in the category are slightly lower. From this measure, the fund is slightly more expensive than the category. If we look at price/book we see a different picture. The fund has price/book of 3 vs. the benchmark of 3.47. The book value of the company is the found by taking all assets and subtracting intangible assets (e.g. goodwill, patents) and liabilities. In theory, this is the value you could generate by liquidating the company. By this measure, we see that the fund portfolio is slightly cheaper than the benchmark.
Of course, the value we are willing to pay for a company is also a function of the future earnings. We see that the long-term earnings % for the portfolio is 11% vs 10% for the benchmark. Based on this forward looking measure, the fund stock portfolio is expected to generate earnings growth higher than the benchmark. Looking at historical cash flow growth, we see that the portfolio has grown cash flows at a rate of 8.37%. Cash flow is the operating cash generated minus any investments (such as new property, plant or equipment). Cash flow growth is often used as a measure of ‘quality’ of a company.
For comparison purposes, I also looked at the S&P500. The top 500 US companies are trading at 17x prospective earnings, with 9.7% projected earnings growth and historical cash flow growth of 5.97. Based on this brief analysis, we may conclude that the portfolio is expected to grow earnings faster than the market and the price of the portfolio is slightly higher than the US stock market or the benchmark on a prospective earnings basis.
The discussion of fund style is interesting. The fund manager uses a ‘value-oriented’, ‘bottoms-up’ approach, according to the information found in Morningstar’s analyst’s opinion (available through premium subscription only). The challenge with assessing the fund vs. the ‘style’ at the aggregate level is that the portfolio holds a range of companies that could be considered ‘value’ all the way to ‘high growth’. For example, as mentioned earlier, the weighting to the biotech sector for this fund is 15%. Generally, the biotech companies as a group have higher forecasted sales and earnings growth and are likely to trade at higher price/prospective earnings. All said, it is important to dig into the details of the sub-industries and companies within a fund.
Evaluating Portfolio Performance
Next we turn our attention to evaluating the fund’s performance. Generally, my model is to hold low-cost passive funds unless a manager has demonstrated long-term performance that exceeds their benchmark on a risk adjusted basis. This sounds simple enough, but in practice evaluating this is not simple.
First, we need an appropriate benchmark. Second, we need an appropriate measure of return. Third, we need an appropriate measure for risk. Finally, we need a way to determine if any excess return is significant.
Previously, I wrote an article that described various return and risk measures found here. Also, I wrote an article on the details of using regression analysis for performance assessment found here. Prior to reviewing the Morningstar data, it would be a good idea to review these articles. Many of the terms and methods I will discuss below are explained in those articles.
Trailing Total Returns
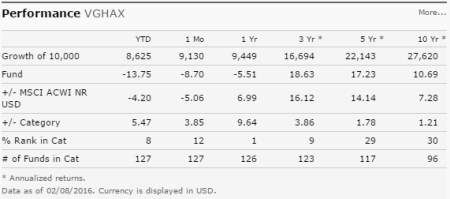
Previously we discussed the summary page for VGHAX which includes the Performance table. I like to look at 3Y, 5Y and 10Y returns vs. the category. VGHAX has returned 18.6%, 17.23% and 10.69% annualized over that last 3, 5 and 10 year periods. Relative to the category, it produced excess returns of 3.86%, 1.78% and 1.21% annually. Before we can judge how good or how bad this is, I’d like to understand the risk and return in more detail.
Ratings and Risk, Benchmark Definition
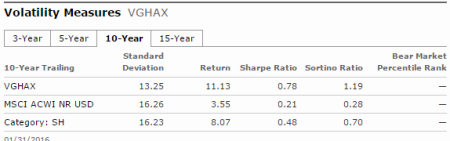
Let start by looking at risk statistics found here. Look for the heading called Volatility Measures and select the tab for ’10-Year’. I like to start with 10Y results because it includes the large market decline in ’08-09.
From the table, we see that the standard deviation for VGHAX returns is 13.25%. Compared to the Category benchmark of 16.23 we see that the fund has slightly lower risk. For comparison, the s&p500 total return volatility was approximately 11%.
One measure I have discussed previously is maximum drawdown. I’d like to see Vanguard add that statistic as well as the Calmer Ratio.
Based on my calculations, the Maximum Drawdown for VGHAX during the ’08-09 market correction was 35%. For comparison, the maximum drawdown for the s&p500 total return was 55%.
The discussion of volatility vs. maximum drawdown is interesting. From the discussion above, we can see that volatility (standard deviation) doesn’t always align with maximum drawdown. We see the downside risk for the fund has been lower than the market when we look at maximum drawdowns. Generally, we know from research that quality companies (measured by return on equity) fall less in market drops but also slightly underperform in rising markets. Also, the healthcare sector is defined as ‘defensive’. Defensive sectors are thought to decline less in down markets compared to cyclical sectors such as consumer discretionary stocks.
Upside & Downside Capture Ratio
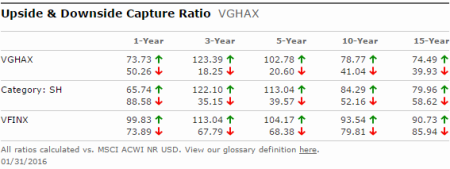
Morningstar also provides data for what they call upside and downside capture ratios. Without going into the details of the calculations (unless you like geometric averages!), essentially the ratio is a measure of how much positive return does the fund provide when the benchmark is up and how much of the downside is captured when the benchmark is down. So, generally we want a high upside capture number and a low downside capture number.
Unfortunately, Morningstar only provides this data relative to the primary prospectus benchmark. Ideally, I would not use MSCI ACWI as the benchmark, but rather would like to use the healthcare category or perhaps the S&P500.
In any case, let’s look at upside and downside capture ratios vs. MSCI ACWI. Looking at 10-Year data we see an upside capture ratio of ~79% and a downside capture ratio of ~41%. So, here we see characteristics of a defensive, quality-oriented portfolio. When the market is up, we capture 80% of the return. When markets are down, we only experience 40% of the drop. Based on this discussion, we can see how we may wish to be in this type of portfolio especially if we feel that there is some risk that we are entering a down market.
Sharpe Ratio
Recall that Sharpe Ratio is a measure of risk-adjusted return. We take the annual return over a period and divide by the annualized standard deviation. From the table with Volatility Measure we see the Sharpe for the fund is .78% compared to the category sharpe of .48%. What this means is that the fund gives us .78% return for each 1% standard deviation risk. On this measure, we would say over the 10-year period that VGHAX has provided higher risk-adjusted return than the average fund in the Morningstar healthcare category of funds.
Benchmark Comparison – Is this fund producing Alpha?
Next we want to know, does this fund produce excess returns or alpha over its benchmark. Morningstar provides regression analysis results for the fund based including R-Squared, Beta and Alpha.
There are several challenges with Morningstar’s information. First, they use the primary prospectus benchmark as the base for regression. I have pointed out reasons this may not be a good idea. Secondly, they do provide a ‘best fit’ analysis that seems to draw from Morningstar defined indices. However, this data only appears on certain of the time horizon tabs. Finally, Morningstar does not provide details on the significance for their alpha and beta statistics. For these reasons, I usually augment any fund analysis data from Morningstar with my own quantitative results.
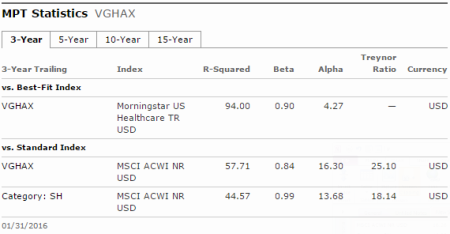
Let’s look at the Morningstar regression results here. I am using the 3-Year data because this is the only period where Morningstar reports the ‘best fit’ index. I prefer to look at a full market cycle when doing regression analysis so 10-Year results are preferred. In any case, the table with the heading ‘MPT’ contains the results. ‘MPT’ stands for Modern Portfolio Theory.
First note that the R-Squared for the best fit is 94 while the R-Squared for the MSCI ACWI index is only 57.7. What this means is that the best fit healthcare index explains 94% of the variation in return of VGHAX while the MSCI ACWI only explains 58%. This supports my earlier conclusion that the MSCI ACWI index is not a good choice for benchmark comparison. I can’t emphasize this enough. I have seen many cases where the prospectus primary benchmark is a poor choice against which to evaluation performance.
Brightwood Ventures Regression Analysis
In this final section, I want to show the results of regression analysis performed by Brightwood Ventures using the R environment.
I performed two sets of regression. First, I selected the iShares Healthcare ETF (ticker: IHY) as the base benchmark and did a single factor regression analysis. Next, I did a multi-factor regression using sub-sector ETFs from IShares including Biotech (IBB), Pharma (IHE), Medical Devices (IHI), and Healthcare Providers (IHF). I used monthly return data from May 1, 2006 to present. (May 1st was the inception date for iShares ETFs used in the multi-factor regression).
Single Factor Regression
From the single factor regression, I found a Beta of .92 and annualized alpha of 1.9%. We can see from the regression results that the beta is highly significant (>99% confidence) while the alpha confidence is 92%. From this analysis, we see that the Fund is providing almost 2% per year excess return with reasonably high confidence.
Coefficients:
Estimate Std. Error t value Pr(>|t|)
(Intercept) 0.0016063 0.0009009 1.783 0.0773 .
ret.m[, “IYH”] 0.9179715 0.0214732 42.750 ***
Signif. codes: 0 ‘***’ 0.001 ‘**’ 0.01 ‘*’ 0.05 ‘.’ 0.1 ‘ ’ 1
—
Residual standard error: 0.009467 on 114 degrees of freedom
Multiple R-squared: 0.9413, Adjusted R-squared: 0.9408
>F-statistic: 1828 on 1 and 114 DF, p-value: < 2.2e-16
Multi-Factor Regression
Finally, I wanted to test the idea of regression of the fund vs. ETF sub-sectors. There are many challenges with using multifactor regression in this manner. In particular, if the composition of the fund is changing over time with respect to sector exposures, we would not expect significant results. Based on prior research, I learned that this fund has always maintained a heavy exposure to the Pharma sector. I wanted to test whether I can see significant Beta to pharma.
Coefficients:
Estimate Std. Error t value Pr(>|t|)
(Intercept) 0.001097 0.001137 0.965 0.3367
ret.m[, “IBB”] 0.034301 0.035546 0.965 0.3367
ret.m[, “IHI”] 0.087661 0.037986 2.308 0.0229 *
ret.m[, “IHE”] 0.520159 0.049139 10.586 < 2e-16 ***
ret.m[, “IHF”] 0.177299 0.032031 5.535 2.1e-07 ***
Signif. codes: 0 ‘***’ 0.001 ‘**’ 0.01 ‘*’ 0.05 ‘.’ 0.1 ‘ ’ 1
—
Residual standard error: 0.01187 on 111 degrees of freedom
Multiple R-squared: 0.9102, Adjusted R-squared: 0.9069
F-statistic: 281.1 on 4 and 111 DF, p-value: < 2.2e-16
We can see that the factor betas to IHI, IHE and IHF are significant. Further, we can see that the Beta exposure to Pharma (IHE) is .52%. Recall that the current weighting in the portfolio to Pharma is 45%. Cool! The overall R-Squared has fallen to 90% (not uncommon as we add factors). Note also that alpha has dropped to 1.2% and the significance has fallen to 66%. We need to be careful not to draw too many conclusions from the multiple regression, but it does confirm that there is a stronger exposure to the Pharma sector.
Conclusion
From the Morningstar data and additional Brightwood analysis, we have a much better picture for this fund. We can see that the fund composition includes multiple health sub-sector components with the largest component being pharmaceuticals. Biotech is currently 15% of portfolio. We have seen that over multiple periods, the fund has produced higher returns with lower risk. We also demonstrated that over the last 9+ years the fund has produced a significant alpha of 1.9% using single factor regression. We also learned that the fund tends to hold up better in down markets, but historically hasn’t captured all of the upside when its benchmark is up.
In part 3 of this review we will take a look at some additional factors such as management and tax costs associated with holding the fund.