In this article, I want to explore some of the quantitative tools we use at Brightwood Ventures to evaluation investment performance. We conduct performance assessments when we make investment selections for model portfolio implementation as well as ongoing performance monitoring. As a general rule, we are biased toward the use passive index investment funds, but we do use active funds that have demonstrated excess risk-adjusted returns. The methods I will demonstrate can be very useful in gaining insights into the character and performance of active funds. In this paper I will use the actively managed PIMCO Total Return Fund (“Pimco Fund”) as in illustrative example. The ticker for this mutual fund is PTTRX.
This article will begin with a discussion of risk and return measures we previously introduced in “Making Sense of Risk and Return Measures” (https://www.brightwoodventures.com/making-sense-of-risk-and-return/). Next I will introduce the use of regression analysis as an additional statistical technique. This article presumes the reader has a basic understanding of statistics and will get into details of regression analysis.
Benchmark Discussion
 To evaluate a fund’s performance we can use a benchmark for comparative purposes. Of course the benchmark should reflect the overall risk and return characteristics for the investment in question. A common concern I have across both equity and bond investments is the appropriate selection of the benchmark. I have seen funds that claim to deliver ‘excess performance’ versus a benchmark that doesn’t reflect the underlying investment. A simple example will illustrate. An active stock equity fund may set their benchmark to be the S&P500 large cap stock index. If the fund has a substantial portion of stocks that are mid cap and small cap issues, the benchmark becomes less useful. Small and mid cap stocks are riskier. To claim that a fund beats the benchmark without disclosing that the fund actually contains more risk than the benchmark or varies substantially from the benchmark should create concern. The regression technique I will introduce can be used to discover the true nature of the fund. The Pimco Fund is an actively managed bond fund. The benchmark is defined as Barclay’s US Aggregate Bond Index.
Risk and Return Measures
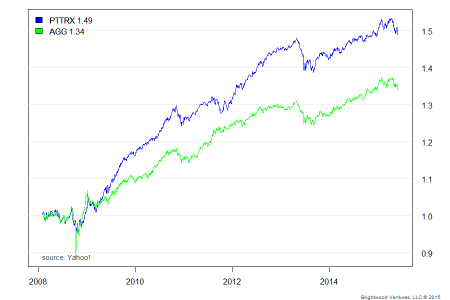
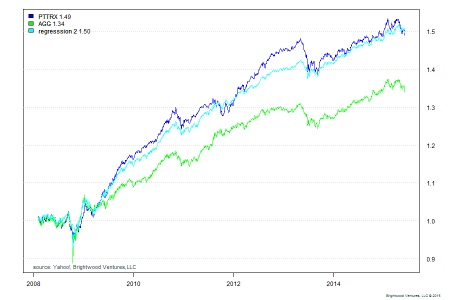
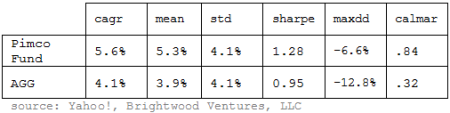 First let’s look at the risk and return measured previously introduced. The period I am reviewing was set based on the availability of certain benchmark data. The return period used was February 2008 through May of 2015 (7+ years). I will be using the iShares AGG ETF as a proxy for the benchmark. All figures are annualized. From the measures listed in Exhibit 1 we can see that the mean return for the Pimco Fund is higher than the benchmark. The standard deviations are similar, but the maximum drawdown for the benchmark was nearly twice as much as the Pimco Fund. The Pimco Fund Fact Sheet states that the fun ”Aims to provide excess return in a risk-controlled framework”. Relative to the benchmark figures above, the fund has historical delivered some excess return.
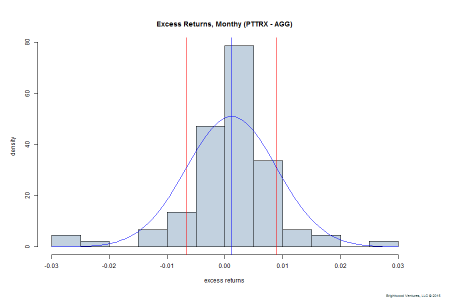 Another useful technique is to generate the monthly returns for both the fund and the benchmark and plot the excess returns. Excess returns is the fund return minus the benchmark return. What are we looking for? First we want to see the distribution of returns. Does the fund consistently beat the benchmark? By how much? We also look at the dispersion of the excess returns. Is the average excess return meaningful given the return distribution? In the historgram of returns included to the right, see a slightly negative sku (the excess returns are not spaced evenly around the mean excess return but tend to be slighly less than the mean). We also look at the outliers. Are the are large number of returns that are either extremely large or small. Here we see that there are more large negative returns than a standard distribution would produce.
What sort of exposure does the fund have compared to the benchmark? When we control for those exposures does the fund still look like it is producing excess returns? Regression analysis of the fund can provide some useful insights. Prior to any regression analysis it is important to understand the type of assets the fund includes as well as the benchmark. Are the assets held in the fund similar to the benchmark? Where there are deviations are those sources of extra risk or return that we need to be aware of? Once again referencing the Pimco Fund Fact Sheet we can see that the fund held 4.8% in high yield credit bonds (3/2015). The underlying Barclay’s index does not have a material portion of bonds below ‘BBB’ rating (below this rating, bonds are considered high yield or ‘junk’). Clearly, evaluating the Pimco Fund based on the Barclay’s index alone may not provide a complete picture. We’ll get back to this point shortly.
Regression Analysis
We can use statistical regression to understand how a fund performance relative to one or more benchmark components and whether the results are significant. Note: Linear regression makes a number of assumptions. There are tests that can be performed to ensure the assumptions are met. These tests are beyond the scope of this paper.
First, let’s begin by looking at the regression of monthly returns of the Pimco Fund relative to the benchmark only. All of the analysis I am discussion here was performed using the statistical programming language ‘R’. Below are the results from the following regression:
Coefficients:
Estimate Std. Error t value Pr(>|t|)
(Intercept) 0.002021 0.000844 2.394 0.0188 *
ret.m[, “AGG”] 0.798112 0.067521 11.820 <2e-16 ***
—
Signif. codes: 0 ‘***’ 0.001 ‘**’ 0.01 ‘*’ 0.05 ‘.’ 0.1 ‘ ’ 1
Residual standard error: 0.007603 on 87 degrees of freedom
Multiple R-squared: 0.6163, Adjusted R-squared: 0.6118
F-statistic: 139.7 on 1 and 87 DF, p-value: < 2.2e-16
From the regression, we see that the R-squared is 61%. The regression explains just of 60% of the variance of the Pimco Fund. The alpha is .00201 (monthly) or 2.5% annually. Both the alpha and the beta coefficients are highly significant. The fund is producing alpha and the exposure to the benchmark expressed in terms of beta is .80. Let’s look at this for a moment. The excess return over the benchmark is 2.5% (alpha coefficient compounded for 12 months), is this the full picture? Well, on one hand we see from the simple risk and return metrics that the fund does generate higher returns for a similar level of risk.
Multiple Regression Analysis
Can we get any more insight on the fund by looking at other benchmarks? Multiple Regression Analysis Using Additional Risk Factors Earlier we noted that the Pimco Fund uses high yield bonds. Certainly these add risk over more conservative benchmark. Another reason that the fund may be outperforming the benchmark could be increased weighting toward investment grade credit debt (corporate bonds). Finally, we could add a short term bond funds to assess exposure to the short end of the government bond market. We can add these to the regression model using the following ETF sector funds: JNK iShares High Yield Bonds SHY iShares 1-3Y Government Bonds CIU iShares Intermediate Credit Bonds The results of the multiple regression follow:
Coefficients:
Estimate Std. Error t value Pr(>|t|)
(Intercept) 0.0009443 0.0006593 1.432 0.155773
ret.m[, “AGG”] 0.1891930 0.0902920 2.095 0.039151 *
ret.m[, “JNK”] 0.0513413 0.0205015 2.504 0.014204 *
ret.m[, “SHY”] 0.8664344 0.2284849 3.792 0.000281 ***
ret.m[, “CIU”] 0.4604954 0.0697383 6.603 3.44e-09 ***
—
Signif. codes: 0 ‘***’ 0.001 ‘**’ 0.01 ‘*’ 0.05 ‘.’ 0.1 ‘ ’ 1
Residual standard error: 0.005656 on 84 degrees of freedom
Multiple R-squared: 0.795, Adjusted R-squared: 0.7852
F-statistic: 81.42 on 4 and 84 DF, p-value: < 2.2e-16
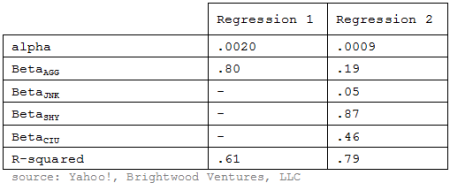
The second model does a better job of explaining the fund’s performance . R-squared has gone up from ~60% to 79%. Looking at the results we find that the coefficients are significant other than the intercept. What happened to the ‘alpha’ we found from the first regression? As we added additional risk exposures the regression is able to explain more of the funds return with the factors themselves. The remaining alpha is less than half of that found in the first regression and with less significance.
Conclusions
 From the multiple regression and detailed review of the funds asset class exposures we have a much better picture about this fund. We found that while there is significant alpha over the defined fund benchmark, as we added additional sectors to the regression the alpha went down.
Given the analysis what would we conclude about the fund manager’s ability to generate alpha? First, we would say the fund does provide alpha over the broad Barclay’s index. It was able to add return with a similar (if not better) risk profile. Regarding the multiple regression we can see that the fund’s returns have significant exposure to high yield and credit bonds in addition to the core benchmark. Notice that the weights or coefficients add to greater than one. If we wanted to construct a synthetic equivalent to the Pimco Fund we would need to invest more than $1 in assets to match a $1 investment in the Pimco Fund. This gives us an idea of the efficiency in returns the fund has generated.
Of course before selecting this fund as part of an investment implementation we would consider a wide range of additional factors such as expense ratio, asset allocation targets (and limits) and manager capabilities. The regression analysis has given us a much better (and quantifiable) understanding of the funds performance.