
Today I would like to discuss my favorite ‘simple’ model for determining if the stock market is over- or under- priced, the real earnings yield or REY. If I could only have one piece of information to gauge the market value, this would be it! This model is also favored by a number of well top economists. Dr. Ed Yardeni discusses the model in his recent book, ‘Predicting the Markets’, chapter 14. John Apruzzese, the Chief Investment Officer at Evercore Wealth Management discusses REY in a recently released paper.
When discussing market valuation the conversation usually starts with the PE or price-to-earnings ratio. The PE ratio is a good starting point because we are looking at a ratio of what we a paying at the price of $1 of earnings on the underlying stock or basket of stocks in the case of a stock fund. One of the major problems with PE ratio is that it doesn’t really address interest rates or the yield other assets are promising such as bonds. Surely the price we should be willing to pay for stocks should vary based on interest rates of other assets. The earnings yield on stocks can help us here. Earnings Yield is the inverse of the PE ratio. With PE 20, the earnings yield = 5%. Now we have something that we can compare to a coupon on bonds. If the year bonds are paying 3%, we might find an earnings yield of 5 – 6% on stocks a reasonable return. To ‘adjust’ the PE ratio or earnings yield we can use the inflation rate to convert form nominal terms into ‘real’ terms. By making this adjustment we get a much better way to compare today’s PE or earnings yield with inflation running just over 2% to historical PE ratios that were lower, but also existed when inflation rates range from 4% to greater than 10%.
As we will show in this article, stock market turns are correlated with real earnings yield. Furthermore, in the next article I will build a very simple portfolio market timing model based on REY to show that this metric would have produced greater returns then a buy and hold portfolio.
Real Earnings Yield
To compute the real earnings yield, we just need the PE and inflation rate. Real earnings yield = (1/PE ratio) – Inflation. The real earnings yield gives us the return we would expect given constant earnings at the current market price over inflation. The concept is elegantly simple. Think about it this way, as a bond investor I would expect to get some return above inflation. For ten year treasuries the real yield has tended toward inflation plus the real growth rate of the economy. For stocks, we should demand a real yield above inflation to compensate us for the extra risk we are taking over a relatively safe bond. Given this definition, REY is appealing based on economic rationale. Has it worked historically?
The chart below shows the total return for the Vanguard S&P 500 mutual fund from 1984 to present. The second panel shows the real earnings yield over the same period. To make the chart easier to see, I plotted the market return on a log scale.
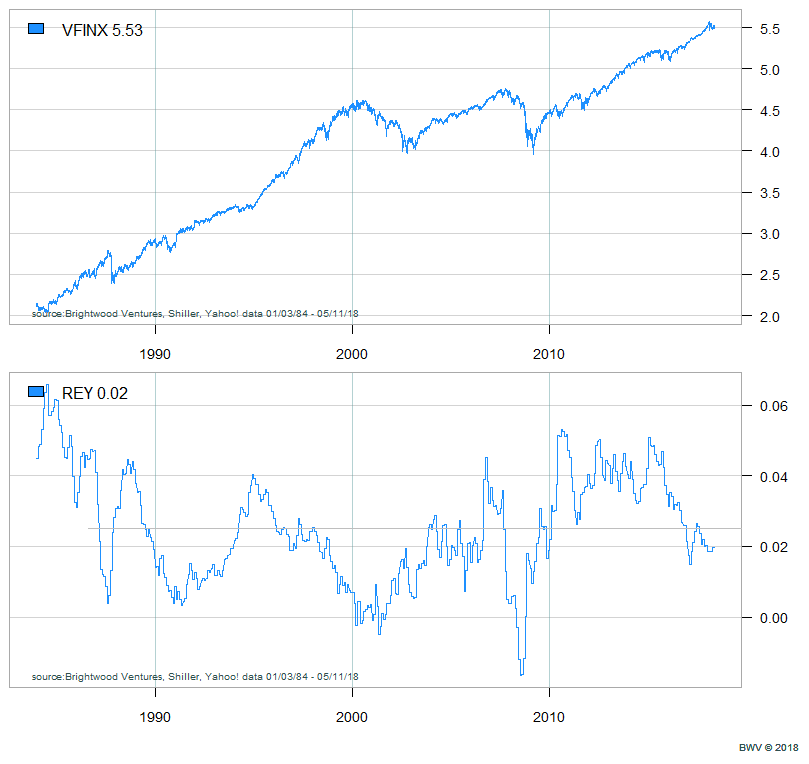
We can see that the REY has varied above and below a relatively flat line. The average real earnings yield for the market over this period was 2.5%. this is as we would expect. Furthermore, notice that when the real earnings yield strays well above the 2.5% average the market tends to perform strongly. When the real earnings yield approaches zero, this tends to forecast major market declines. Notice how the real earnings yield approached zero before crashes in 1987, 2000, and 2008. This is exactly what we should expect to see. When stock prices rise, real earnings yield falls. If it gets close to zero, why take any more risk then we need to? Just cash out and buy bonds!
Does Real Earnings Yield Predict Future Stock Returns?
To answer the question, I took data from 1984 to present and generated monthly real earnings yield and stock market returns for the next month.
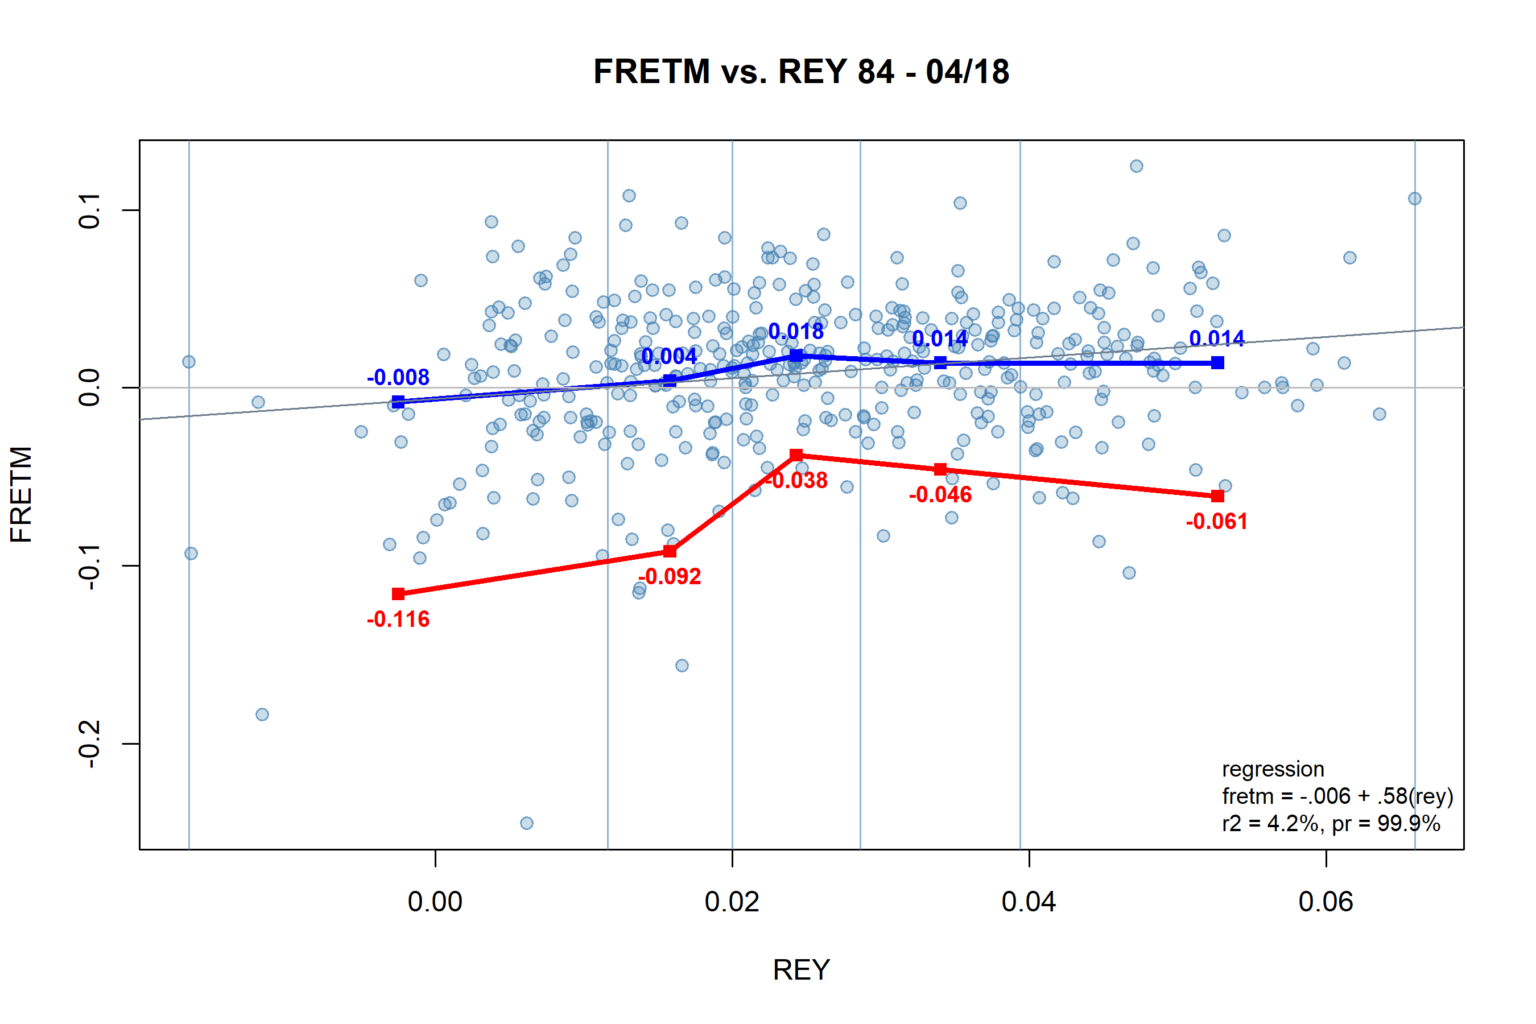
First, note that the returns points tend to be higher as we move to the left with higher real earnings yield. Next, notice the worst market returns are clustered on the left side of the screen.
Next I ran a regression. The regression line appears on the chart as a straight line. The regression shows that next month returns (FRETM) is approximately equal to .58 x the REY. The correlation between REY and FRETM is approximately 20%. The significance for the regression is > 99%! While there is quite a bit of variability in the data points, we can it is pretty in particular that large market drops appear to be related to extremely low earnings yield.
To detail this further, I plot a blue line and a red line on the graph. Let me explain these. I broke the data in five equal groups (quintiles). I computed the mean for that group and plotted this on the chart. We can see that the mean return for the lowest 20% REY values is less than zero! When real return is below ~ 1% we can expect on average to earn zero real return in stocks! When REY is above 2% we get substantially better average month returns, roughly 1.5% on average.
What about risk? To show how risky it is to be in the market when real earnings yields are low, I computed the conditional value at risk @ 10% (CVAR10). Conditional value at risk is the average loss we should expect to experience in 10% of the cases. The red line plots CVAR10 for each of the 5 quintiles. Note that the lowest REY has a CVAR10 of -11.6%. This means that 10% of the monthly returns will generate on average loss of 11.6%. The CVAR10 for the top three quintiles is substantially lower at 4-6%.
Another way to look at risk is to compute the odds of experiencing large drop. Over time, the worst 10% month returns were losses of 4.2% or greater. When I computed the odds of a loss greater than 4.2% by each quintile the results were consistent with CVAR10. The odds of suffering a loss of 4.2% or greater were 21% for the lowest quintile, 11% for quintile 2 and just 5% – 8% for quintiles 3-5.
Conclusions
From the regression analysis presented, we can see that historically the real earnings yield has been significantly correlated with future returns. Next month stock market returns are significantly related to prior month real earnings yield. Although there is quite a bit of variation in the monthly returns, clearly we can see that large market drops tend to occur with environment where real earnings yield is below 1%.
Where do we stand now? REY is about 1.8%. This puts us at the 35th percentile. The REY doesn’t address earnings growth or changes in interest rates. At this point, earnings for 2018 are forecasted to grow above 15%. Interest rates for the 10Y are 3.12. We will continue to watch REY closely and will start increasing our cash or bond allocation if REY falls below 1.5%
In the next article, I will build a signal for timing the market based on REY and build a simple quantitative model portfolio that beats the S&P500 in simulations!