
In Part 1 I introduced the real earnings yield model (REY) for stocks. The real earnings yield is simply the earnings of the stock(s) divided by the price in real terms (after inflation). As we showed in the last article, 1) the future return for the S&P 500 is significantly related to the current real earnings yield, and 2) the risk of large drops in the stock market are much more likely to occur when the real earnings yield is close to zero.
In this post, I will show how to build a simple quantitative algorithm and simulated portfolio based on the real earning yield. This will serve as a basic introduction to quantitative trading models and show how REY could be used to modify equity allocation based on stock prices.
Disclosure: the results discussed here should not be considered a recommendation. The results are based on historical simulations and not real returns. Fees and slippage have not been included in this simple exercise (although there is minimal trading and these costs should be quite low in a practical implementation).
Timing Portfolio Definition
First, we need to define a strategy for the timing portfolio. Let’s create a simple portfolio where we will be 100% invested in the S&P 500 Vanguard Index fund (VFINX) when the REY is favorable. When REY is unfavorable we will be 100% in bonds. For the bond portfolio, let’s use the Vanguard long term bond fund (VUSTX).
REY Timing Signal
Next, create a signal for determining whether to be in stocks or bonds. We know from the last article that the stock market does poorly with REY close to 0%. Let’s say that we will switch to bonds whenever the REY falls below 1%. When should we go back into the market? From history, we also know that when markets have large drops volatility continues for a period. We will need to account for this somehow. We could wait for volatility to fall. We could wait and re-enter only when the market moves above some long term average. In this example, I’m going to go with simply re-entering when the real earnings yield goes above 2%.
At this point, it is important to point out some issues with quantitative models. First, we are looking at history and in the future models may not perform as well. That said, one of the reasons I like this model is that it is economically sound. If we are getting a good price relative to earnings and we don’t think that the world is ending any time soon (i.e., we think earnings will grow consistently with GDP over the long run), it is reasonable to expect that real earnings yield model will hold in the future. A second issue is known as ‘snooping’. We have some historical data, we find a model that works by selecting the ‘right’ parameters. If we try long and hard enough we may find relationships that seem to work historically but don’t in the future. To combat this, it is important to have a model that is supported with economic or behavioral rationale. In addition, robustness of the model should be tested. In our case, if we can vary the REY timing based on different levels of REY and it still holds this would give us more confidence.
In the graph below, I have plotted the REY, the REY timing signal and some additional price information that we will get to shortly.
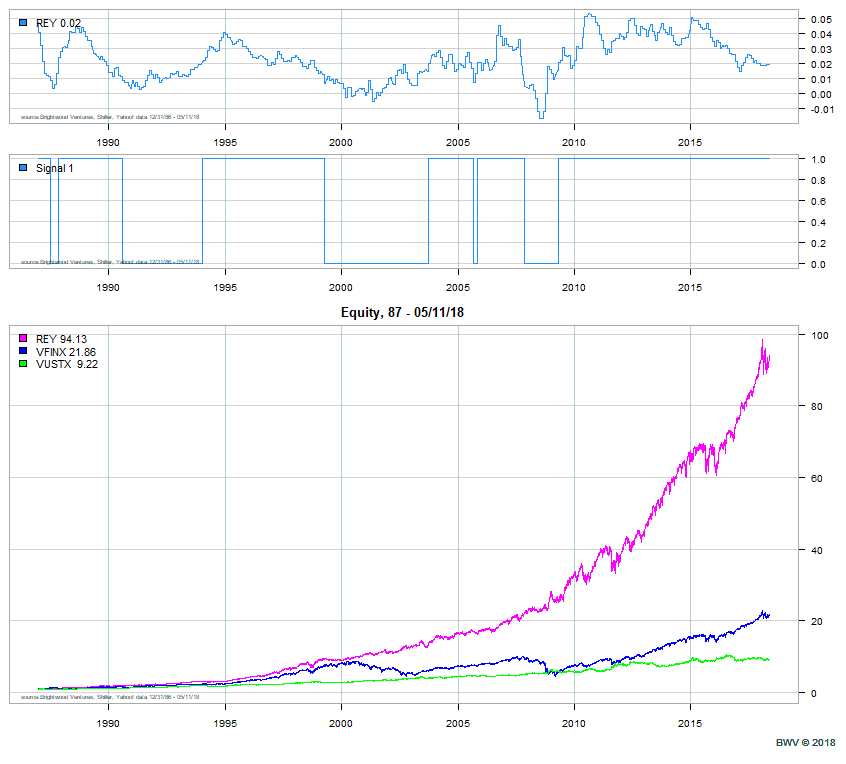
First, notice the timescale. I have plotted REY and Signal from 1984 to present. Notice that the signal is ‘1’ when REY is high and ‘0’ when REY is unfavorable. Also, notice that the number of periods when the signal is ‘0’ is just 5 times. Since 1984, the model has signaled switching to bonds 5 times. The signal is ‘0’ roughly 30% of the time since 1984. More interesting is that the model signals to go to bonds before large market declines in 1987, 2000 and 2008-2009. The signal went to ‘0’ in August of 1990 and back to ‘1’ on January 1994. The market dropped early in the period and then started a steady climb. However, bonds outperformed the market during the full period! From Sept ’05 – Oct ’06, the signal was ‘0’ but stocks outperformed bonds during the full period. So, out of 5 signals for switching to bonds, the model correctly avoided 3 large market drops, one time it outperformed the market with lower risk and one time it underperformed the market.
Model Portfolio Results
Finally, let’s look at a portfolio created by switching between stocks and bonds. In the chart above, the third panel shows the total return of VFINX (stock fund), VUSTX (long term bond fund) and REY portfolio built by switching between stocks and bonds. How did the REY portfolio perform historically?
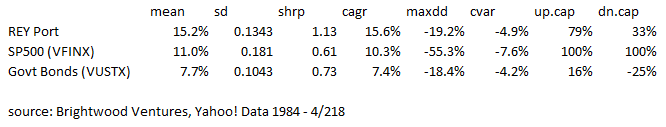
The average annual return for the S&P 500 fund during the period was 11%. The REY portfolio simulation return was 15.2%! The compounded return for REY was even better. The compounded return was 15.6% annual vs 10.3% annual for the S&P 500 fund. Why? The REY portfolio avoided the most significant drops. We can see this in the statistics above. The maximum drop for the S&P 500 was 55% (this occurred in the ’08 – ’09 financial crisis). The REY portfolio maximum drop was just 19%. We can also see that the REY portfolio captures 79% of the market upsides (this is the average return for REY when the market return is positive). The REY portfolio captures just 33% of the stock market downside!
Conclusion and Application
Overall, the REY portfolio produced alpha of 5.3% annualized (compounded annual return) with less risk!
What is the practical application of this? For my wealth management business I use a combination of strategies when building portfolios. I use fundamental factors, quality stock factors and both fundamental factors and technical factors. REY is part of a much larger set of tools I use on an ongoing basis.
For do-it-yourself investors, REY could be used as a factor in deciding how much equity risk you should be taking. Let’s say you have a solid understanding of your financial plan and return needs as well as your risk tolerance. (If you don’t, stop here. Without a solid risk-return understanding, trying to implement quantitative models is asking for trouble). Once you have a target equity allocation you could vary your equity allocation up or down from the target allocation based on the current real earnings yield. When Rey is under 1%, it may be advisable to scale back equity by 10-20% or even more. If the real return goes above 4%, this may be a good time to put cash to work or possible increase equity allocation by 10%. Again, this discussion is for education only and not a recommendation for your specific situation. If you have questions, feel free to get in touch with me.