
, cc2.0)
Stock market returns for US stocks, international developed stocks and emerging market stocks through November are all above 20%. Now is a good time to update our relative value analysis for various equity asset classes and US vs. international markets.
In this review, I am going to introduce a new relative value analysis model that is focused on understanding the relative attractiveness between US asset classes and US vs. international markets. We will start with a simple earnings growth model. The justified PE can be expressed as (1 + g) / (r –g), where g is growth in earnings and r is required return. We have previously discussed this model in detail here.
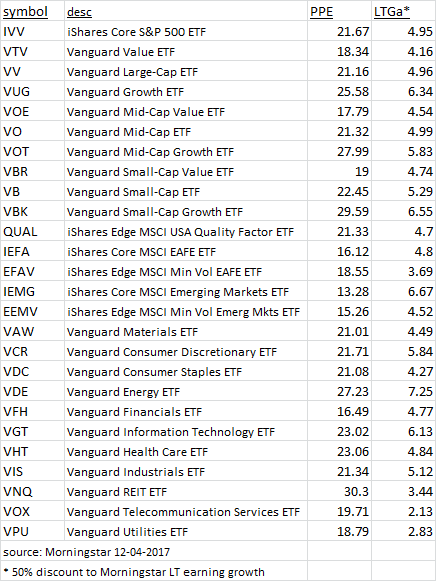
For this update, since we are focused on relative value compared with the S&P 500, we will make some simplifying assumptions. We will explore the relative attractiveness of various sectors by considering ETFs that track the targeted asset classes. For earnings growth, we will start with Morningstar data for long-term earnings estimates. This data captures analyst estimates for long-term growth for the stocks held in each of the funds. We know that analysts tend to produce forecasts which are too optimistic and earnings produced by companies are not always reinvested with returns required. As a simple adjustment, let’s cut the long-term earnings estimates in half. We can use the prospective earnings from Morningstar for the PE ratio. The prospective PE is the price per share of stock divided by the earnings per share. Earnings used are the earnings for the current year plus any forecasts for the final quarter. So, using this data, we now have estimates for ‘PE’ and ‘g’.
The following table captures the price to prospective earning (PPE) and the adjusted long-term earnings growth (LTGa) based on various sector and asset class ETFs based on Morningstar data from December 5th.
What about ‘r’, the required rate of return? Let’s make another assumption. Let’s assume that the US stocks are fairly valued. This may or may not be the case, but since we are focused on the relative value compared to other segments let’s work it forward. If we plug in the ‘PE’ and the ‘g’ for the US market the implied market rate of return is 9.8%.
The next graph plots LTGa vs. PPE for the funds. In addition, let’s plot a ‘fair value’ line assuming the S&P 500 is exactly at fair value. We end up with the following graph:
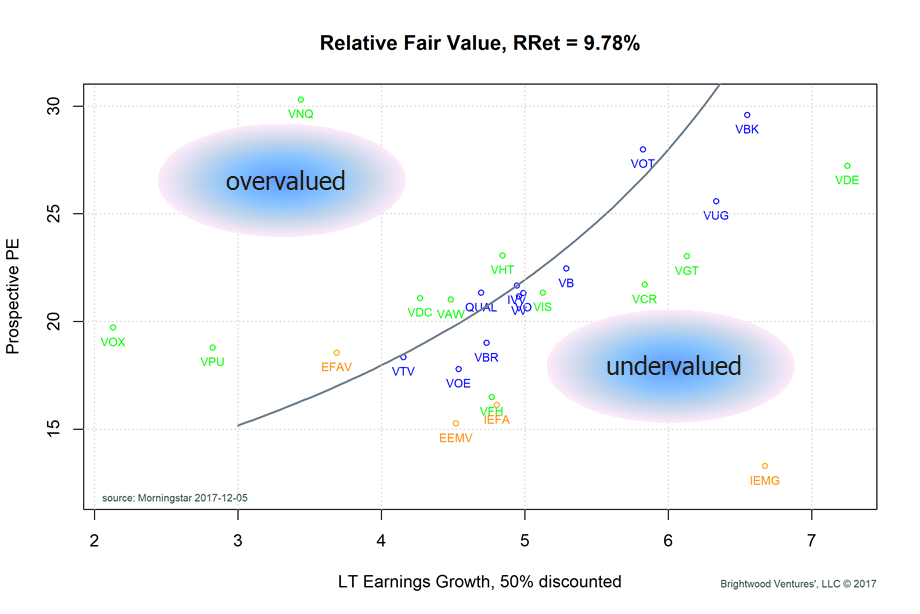
Any points that are above and to the left of the black ‘fair value’ line are considered to be overvalued. Any points lower and to the right of the ‘fair value’ line are considered undervalued. Using this approach, we get a visual look at how the PE varies with growth and we get a view as to the relative attractiveness of various asset classes and sectors. Notice that S&P 500 ETF (symbol IVV) is on the fair value line. Remember, what we did was derive a required return assuming the US is fairly valued. This may or may not be true, but what the graph does show us is the relative value of other asset classes assuming the US market is ‘fair’. Using this approach, we highlight a few key points:
- First note that the ‘fair value’ says that we should be willing to pay more for companies with higher growth.
- Second, note that most of the points are centered about the ‘fair value’ line. It appears that the market is generally valuing the asset classes in a way that is consistent with the earnings assumptions.
- Third, the international ETFs, including developed countries (symbol = IEFA) and emerging markets (symbol = IEMG), are well below the ‘fair value’ line. The market is telling us either the required return is much higher than the US and/or that the growth that can be expected is lower than the US.
Summary
Over the course of the last 12 months, the prospective PE for US companies relative to developed international stocks has risen. At the same time, the growth assumptions have started to converge with US growth assumptions just .25 -.5% above international.
Emerging market required returns should be higher than the US, given higher likely risk. Still, the PE levels for the US are more than 50% higher than emerging markets. Even if required returns for emerging markets were 14% and growth was reduced to 6%, the PE ratio for emerging would still be fairly priced.
For these reasons, we are favorably inclined to holding both developed market and emerging market stocks. In particular, we see good opportunity within china tech companies such as Alibaba, Bidu, and Tencent. These companies have strong market positions in China and should enjoy success given the size and growth of the local markets.