 In this part 2, we will take a look at the current state of the US economy recovery. One of the key data sources I use for macro economics is the St Louis Federal Reserve Economic Data (FRED). This data is free to the public.
In this post, I’ll present a mosaic for the US economy based on data coming from FRED. To organize the discussion, let’s look at the retail sales, the employment picture, and consumer sentiment.
• Retail sales dropped 22% from Jan – April, by July they recovered and grew by about 1%
• Total non-farm jobs declined 15% and since recovered about half of that by September.
• Initial jobless claims remain high, 840,000 for the week ending Oct 3.
RETAIL SALES
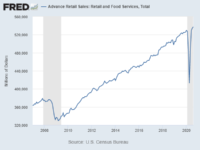
First, let’s look at total retail sales. A good deal of the discussion regarding coronavirus impact has focused on the shape of a recovery. Retail sales data supports the argument that we are in the midst of a ‘V’ recovery.

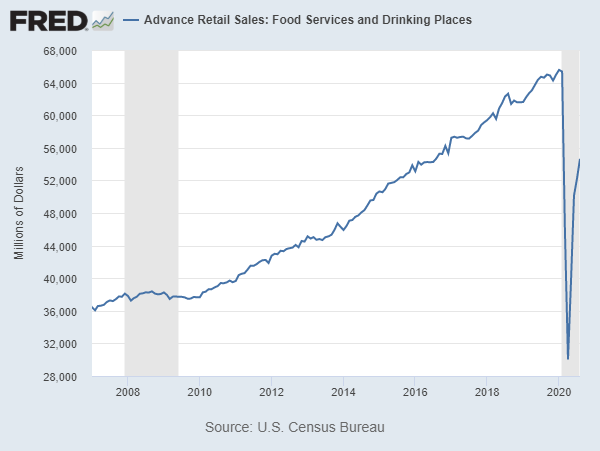
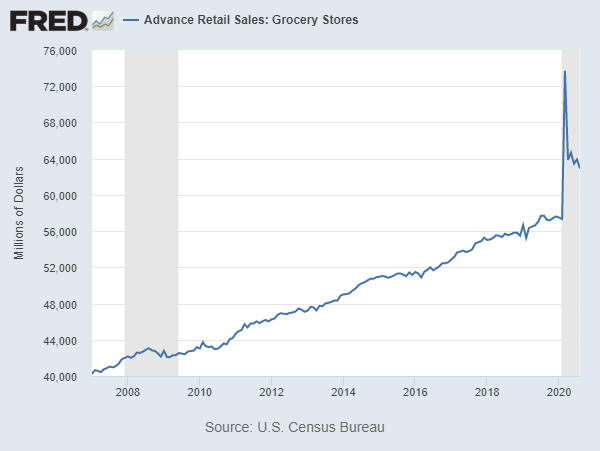
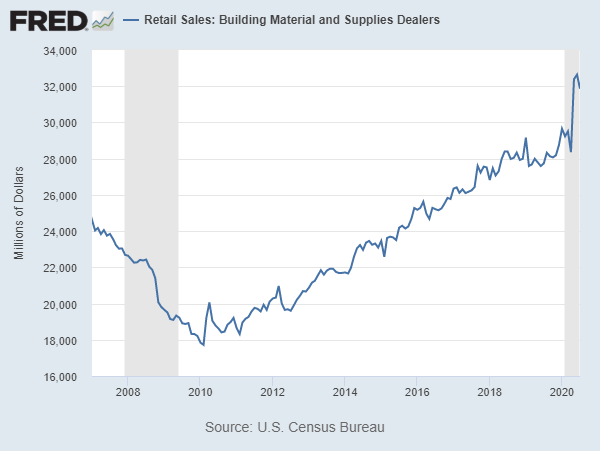
The impact to retail sales has varied dramatically by sector. Food and Drink sales were the clear loser, while grocery sales and retail home building materials were clear winners.
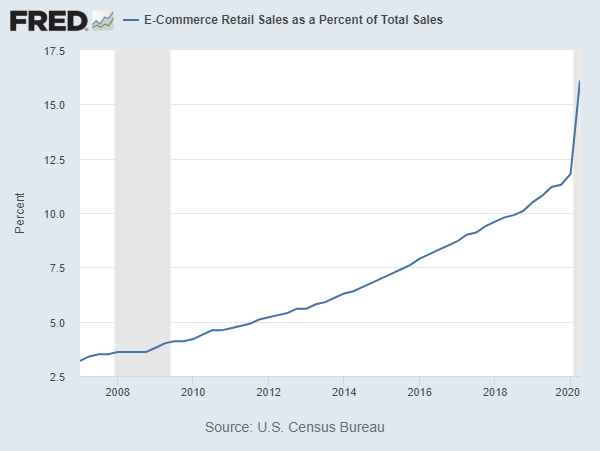
Online ecommerce sales jumped dramatically. Q2 online sales were 16% of total sales, up from 11.8% in Q1.
As we would expect, returns for companies in these categories have been correlated with the growth. Amazon (+82%), Home Depot (+31%), Target (+27.9%) and Darden Restaurants (-8.97). Yes, stock prices should and do follow change estimates in growth!
EMPLOYMENT
As discussed in part 1, the unemployment rate for September fell to 7.9%, down from a peak of 14.7% in April. The result is better then expected vs. the Federal Reserve estimate of 9.3% for year end 2020.
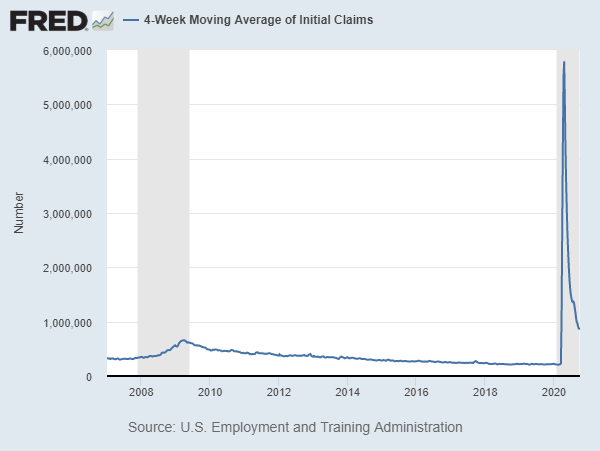
However, initial jobless claims remain persistently high. The most recent figure from Oct shows a 4-week moving average of new job loss claims of 840,000. This figure prior to coronavirus had been running about 250,000.
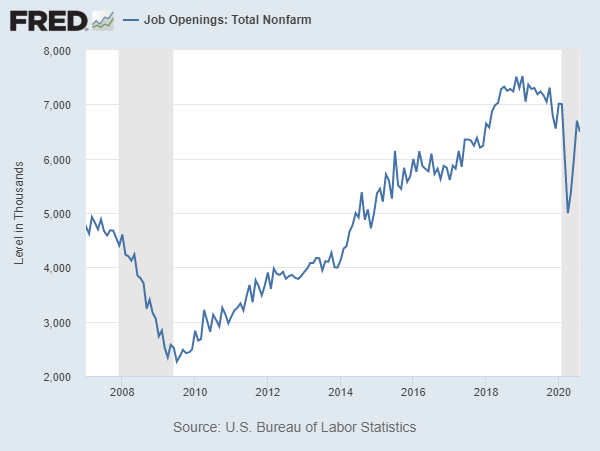
Job opening is another interesting indicator. August job openings were 6.493 M in August, down from 7.52 M peak in Jan 2019 (-13.65%).
From the employment data, some economists have expressed concerns that the ‘V’ recovery may be starting to stall.
CONSUMER SENTIMENT
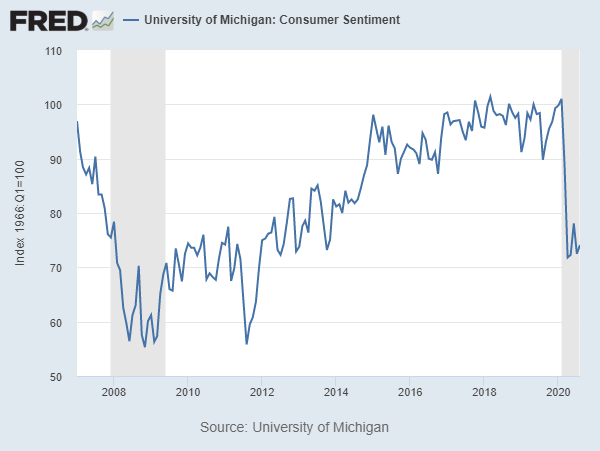
Consumer sentiment hit a low of 71.8 in April but has since recovered somewhat to 74.1. This reading is similar to the level we were at in Dec 2007 at the start of the financial crisis. In that period, the low was put almost a year later in November of 2008 at 55.3.
So far, retail sales numbers show that consumers are still spending money. Automobile sales have rebounded as have existing home sales.
EARNINGS ESTIMATES FOR 2021
S&P 500 Dow Jones aggregates earnings estimates by sector. Based on data from Oct 8th, I plotted earnings estimates comparing 2021 to 2019 data.
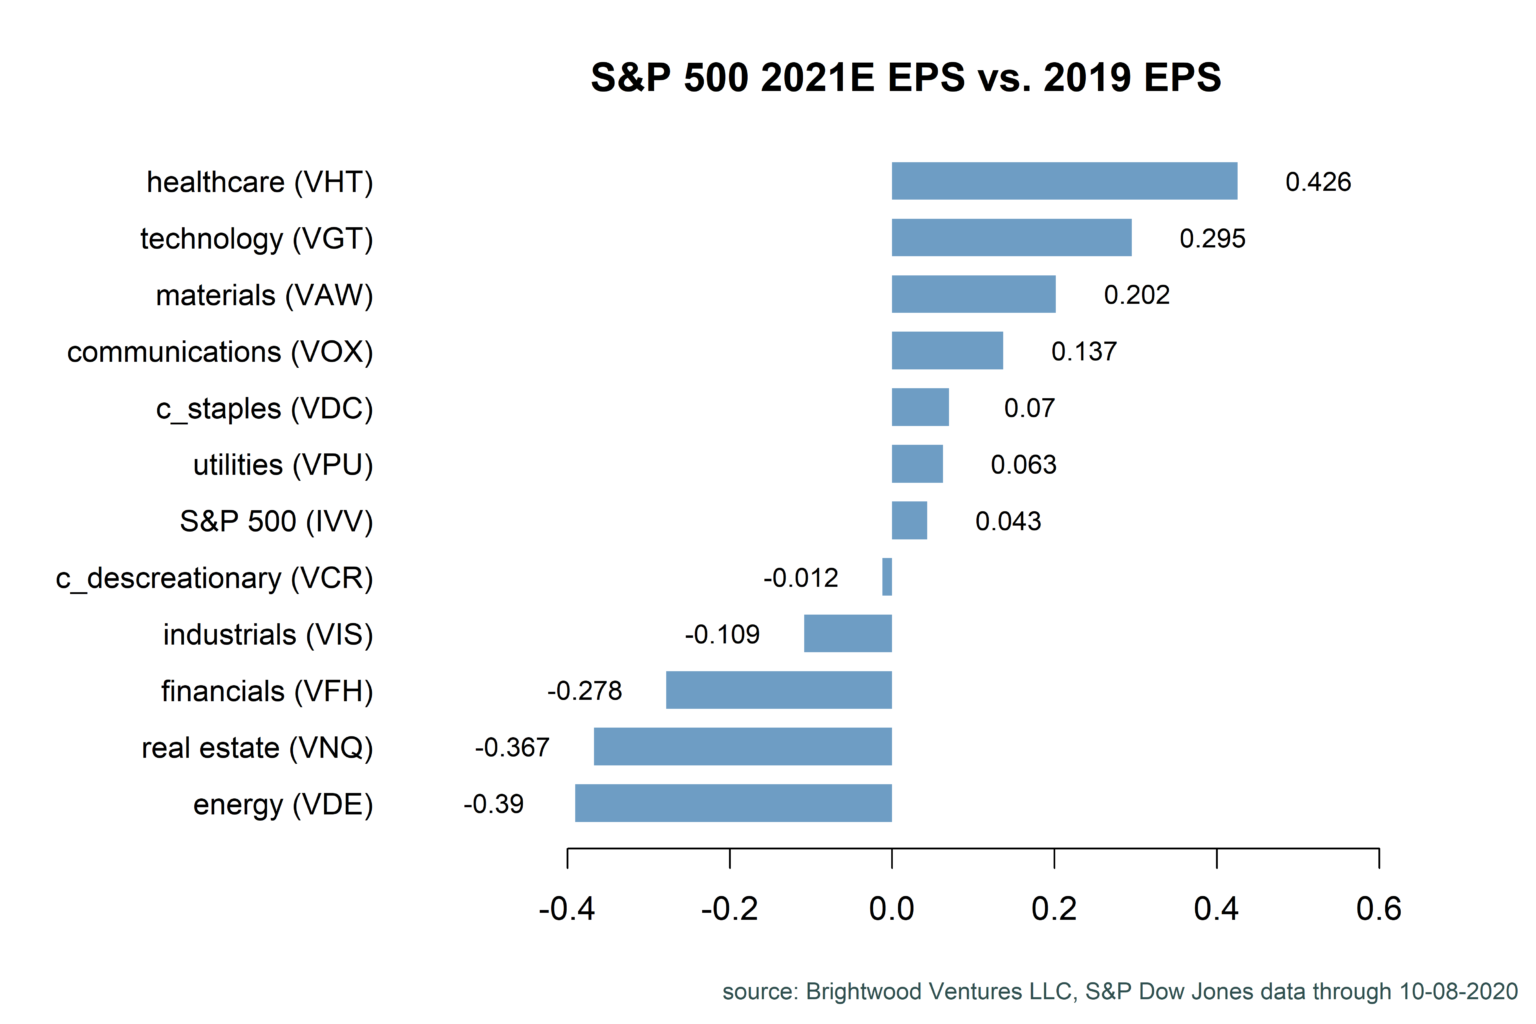
From the chart, we can see that the analysts are forecasting robust recovery for the healthcare, technology, materials and communications sectors. Earnings for energy, real estate and financials (including banking) are expected to remain depressed.
In aggregate, for the S&P 500 companies, earnings are expected to grow 4.3% higher in 2021 over 2019.
ANALYSIS
Using Federal Reserve GDP forecasts, 2021 GDP should be 1.825% above 2019 (real terms). Using the Fed’s PCE inflation estimate of 1% for 2020, the nominal growth in GDP for 2021 would be 3.825%.
The estimates for the S&P 500 earnings are closely aligning with these Federal Reserve estimates.
Based on current stock prices, the stock market is pricing in robust growth with earnings recovering to 2019 level by 2021. In part 3, we will dig into the details by sector and asset class and discuss relative value.