
The Trustees of the Social Security and Medicare trust funds released their annual report today. The report covers the next 75 years with projections running through 2090.
A summary of key findings:
• Social Security’s costs exceed income (excluding interest) throughout the entire period, as it has since 2010.
• Interest income and redemption of trust fund assets are sufficient to cover the deficit until 2034, when trust reserves will be depleted.
• From 2034 – 2090, projected income (primarily payroll taxes and income taxes on benefits) will cover approximately 75% of projected benefits.
Background
Social Security is made up of two separate trusts. OASI is the Old Age and Survivors Insurance trust. DI is the Social Security Disability Insurance trust.
Medicare is made two separate trusts. HI is the Hospital Insurance Trust Fund. SMI is the Supplemental Insurance Trust Fund.
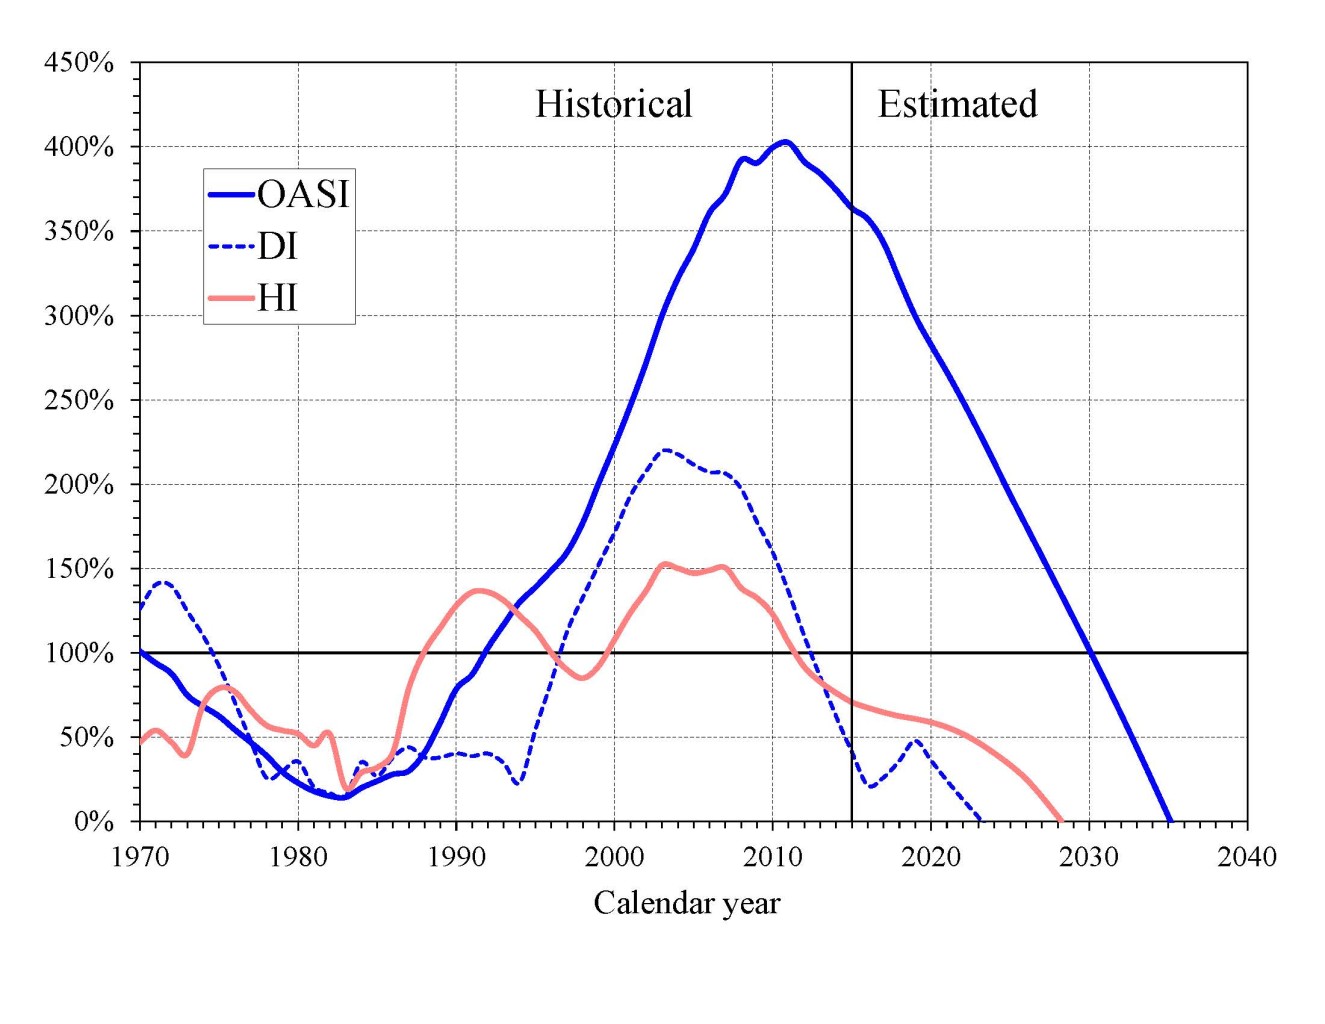
The following chart is a graph showing the Trust Fund Ratios for the OASI, DI and HI trusts. The ratio takes the annual cost and divides by the asset reserves.
(SMI is excluded as the majority of the financing for that trust comes from the general fund and participant premiums. )
Chart E—OASI, DI, and HI Trust Fund Ratios
[Asset reserves as a percentage of annual cost]
Can You Put the Problem in Context?
Social Security and Medicare represent 41% of the Federal Budget. Alternatively, we can look at the costs as a percentage of GDP and/or payroll taxes.
Social Security and Medicare costs as a percent of total payrolls are projected to grow from 8.54% in 1970 to 22.76% in 2090. Currently, the social security tax on payroll is 12.4% of the first $118,500 of wages.
Social Security and Medicare costs as a percent of GDP is projected to grow from 3.8% in 1970 to 12.1% in 2090.
How Does the U.S. Compare to other Countries?
The Organization for Economic Co-operation and Development (OECD) is an international economic organization including 34 countries. According to an OECD report published November 2014, the average OECD country spent 22% of GDP on social expenditures. The total U.S. social expenditures for 2014 was 19.23% of GDP. (Note that the OECD data for social expenditures is more broadly defined than just Social Security and Medicare. For example, unemployment benefits and early education and care for children up to age 6 is included.)
According to the report, social spending for most countries is at historical highs. Average spending has risen from 11% of GDP in 1970 to 22% in 2014. The reported noted that spending in recent years has been declining in Canada, Estonia, Germany, Greece, Hungary, Iceland, Ireland and the United Kingdom. In 2014, the highest spending was found in Belgium, Finland, France (32% of GDP), Italy, Austria, Sweden, Spain and Germany. Lowest spending was found in Turkey, Korea, Chile and Mexico which spent less than 15% of GDP on social programs.
What can/will Lawmakers Do?
The Trustee’s report clearly identifies the problems facing Social Security and Medicare and recommends that lawmakers “take action sooner rather than later to address these shortfalls”.
A wide range of policy options for solving the problem exist. Options range from increasing payroll taxes to cutting benefits. Benefit cuts could come through a range of options including means testing and/or reductions in cost of living adjustments.
The shortfalls are not a new problem. The political will and cooperation across party lines needed to solve the problem make forecasting when the problem will be solved difficult.
How Should this be Factored into Retirement Planning?
Given the future uncertainty regarding Social Security benefits, I believe the most prudent approach for financial planning is to model benefits at 50 – 75% of current levels. As noted in the introduction, the Trustees find that approximately 75% of projected benefits are sustainable after 2034. Given this, Brightwood Ventures typically runs financial planning scenarios with the assumption that Social Security benefits will be 50 – 75% of current levels.
If you have any questions on this article or your financial plan and the impact Social Security has on your retirement, please call us.