
For the S&P 500 companies, sales per share grew 1.1% in Q2 over the prior year. Earnings fell by 1.1%. Meanwhile, the S&P 500 index total return for Q2 was up 2.46%. (Numbers are based on actual Q2 earnings as reported by 95% of S&P 500 companies combined with forecasts for the remaining companies). Source: S&P 500 Earnings and Estimate Report, 8-18-2016.
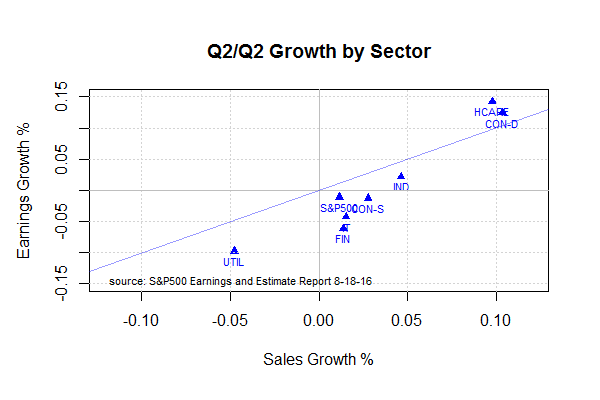
The following chart shows the Q/Q earnings growth vs. Q/Q sales growth by sector. Healthcare and Consumer Discretionary sectors grew earnings at 14.2% and 12.4% respectively. The energy sector does not appear on the chart given the large Y/Y sales decline of 27%. Earnings per share loss of -$2.06 in Q2 compared with a prior year loss per share of $.51. This marks the sixth consecutive quarter with negative earnings for the energy sector.
Based on reported earnings and 8/18 closing price of 2187.02, the S&P 500 was trading at a 25.15 multiple to reported earnings and a forward operating earnings multiple of 19.75 based on 2016 analyst forecasts. Market returns in excess of sales and earnings growth continue to put upward pressure on multiples expansion.
Although it is common for analysts’ estimates to be over-stated and adjusted downward over time, one key concern I have is that 5Y earnings growth estimates are substantially higher than historical sales growth rates. In the following chart, I show the analyst 5Y earnings growth estimates vs. the 3Y compounded annual growth rate in sales (CAGR). Generally, a company cannot grow earnings faster than sales over long periods of time. To grow earnings faster than sales, a company would need to expand operating margins and/or reduce the number of shares outstanding with share buybacks.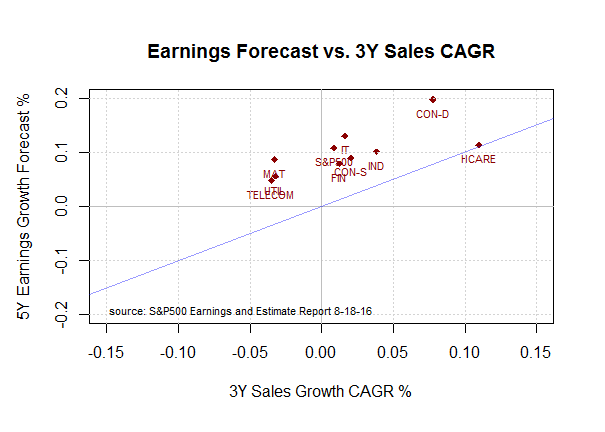
Factset reported a 15% year over year increase in share buyback in Q1. Factset noted that Healthcare buybacks in Q1 were a large contributor. The buyback yield on the S&P 500 was estimated at 3.3%, the highest ratio since Q1 2014.
Interestingly, Howard Silverblatt at S&P noted that 42% of issues reporting Q2 earnings had higher shares outstanding over the prior year. Roughly 10% had greater than 4% dilution. Companies issue new shares to the public and to employees and executives as incentives. Share repurchases can be used to offset the dilution from incentive shares & options.
Given the gap between forecasted earnings to historical earnings and sales growth, high operating margins and earnings dilution we remain on a defensive posture with respect to US equities.