
Today we’ll take a look at the iShares Edge USA Quality Factor ETF (symbol: QUAL). Morningstar rates this fund ‘Silver’ with 4 stars. The star weighting is based on historical risk and return compared with peers. The Silver weighting is Morningstar’s fund rating based on future outlook for the fund.
Fund Strategy
According to the iShares fact sheet, ‘The iShares MSCI USA Quality Factor ETF seeks to the investment results of an index that measures the performance of U.S. large- and mid-capitalization stocks as identified through three fundamental variables: return on equity, earnings variability and debt-to-equity.’ The fund tracks the MSCI USA Quality Factor Index.
The fund strategy is based on the idea that stock performance can be characterized in relationship to underlying factors or attributes. For a detailed discussion on factor-based investing see the previous three part series here.
According to MSCI, the MSCI Quality Indexes complement existing MSCI Factor Indexes and can provide an effective diversification role in a portfolio of factor strategies.
Quality Factor Detail
The MSCI index ranks stocks based on three attributes, together that make up their definition of ‘Quality’. The first factor, Return on Equity (ROE), is the earnings of the company divided by the book value of equity. Based on financial theory, those companies with higher ROE should provide better returns then low ROE companies. The second component, earnings variability, is a measure of earnings consistency. Financial research suggests that historically, financial returns are better for companies with consistent earnings. Finally, debt to equity helps measure potential for financial distress. Companies with high debt are more likely to become distressed when credit conditions tighten in the late stages of the business cycle.
Based on long term historical data, we can expect quality stocks to decline less in a market decline. At the same time, they may lag slightly in bull market runs. Indeed, using the Morningstar metrics for upside capture and downside capture, over the past five years ending 1/3/2019 the QUAL ETF has captured 92% of the market return during positive months and just 86% of the losses when the market has a negative month.
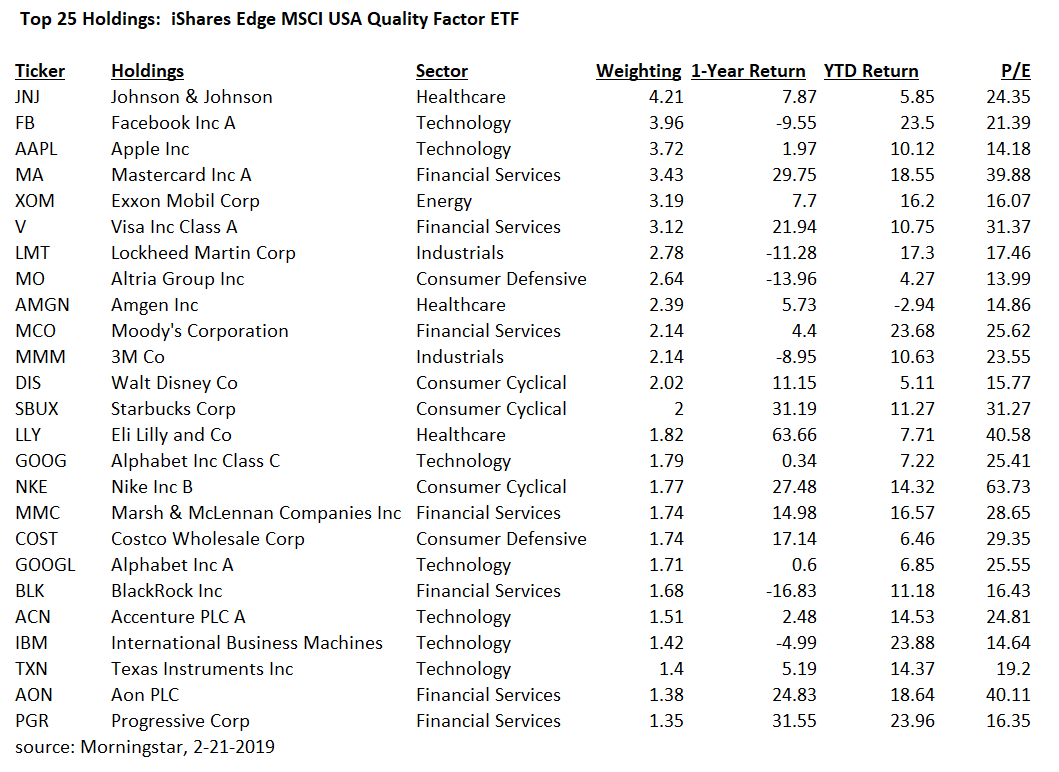
Fund Top Holdings
The following table provides a list of the top 25 stocks along with their percentage weight in the fund, recent performance and each stocks current PE.
Fund Historical Risk and Return
Over the past five years, Morningstar shows that the fund has above average return and below average risk compared to other funds in the Large Blend category. The fund performed in the top 9th percentile during that period. Over the past year and three years, the fund ranked in the 21st and 57th percentile respectively.
The fund return over the past five years has been 11.03% (net of fund fees) compared with the S&P 500 total return of 11.01% (gross of fund fees). Over five years the Beta is .96% and the alpha is .32%. The fund produced a sharpe ratio (return divided by risk) of .93, this was essentially the same as the S&P 500.
Expenses for the fund are .15%, this is below the category average of .36% but higher then pure index funds.
Conclusion
According to Morningstar Analyst Alex Bryan, CFA, “IShares Edge MSCI USA Quality Factor ETF QUAL is a great low-cost index strategy that should hold up a little better than the market during downturns. While it probably won’t beat the market in strong rallies, it should offer better risk-adjusted performance over the long term, supporting a Morningstar Analyst Rating of Silver.”
Morningstar noted that from late 2007 through early 2009, the MSCI index lost 47% while the MSCI USA Index lost 54.7%. According to Bryan, ‘The types of stocks the fund favors have tended to hold up a little better than average in market downturns.’
Based on historical research, we do believe stocks with exposure to quality factors may provide better risk adjusted returns. However, it is important to note that the factor-based portfolios can deviate from past historical results. Also, excess return to factors can vary over time. In the most recent market drawdown in Q4, the QUAL ETF fell 14.61% while the S&P 500 total return was down 13.52%. However, QUAL is out-pacing the S&P 500 so far this year, up 13.01% vs. 11.74%.
Additional Information
MSCI index details here
Morningstar ratings here
iShares fund information here