• We estimate the fair value for the US stock market (S&P 500) using a discounted cash flow model
• We assume a negative earnings shock of 20 – 30% in 2020, followed by a 3-year recovery
• Using this model, the fair value for the S&P 500 falls in a range 2,542 – 2,905
In this article, I will make some high-level assumptions about earnings to derive a range of fair value estimates for the S&P 500. It is important to point out that Coronavirus impact to the economy will very greatly by industry. In addition, companies with high amount of debt will face difficulties. The analysis I am doing here will make some assumptions on the US stock market as a whole, industry and company specific valuation analysis would add additional value.
First, let’s start with a basic discounted cash flow model. In 2019, the S&P 500 earnings were $139.47. The index ended 2019 at 3230.78. The trailing PE as of the end of 2019 was 23.16. Let’s assume a starting point required rate of return of 7.5%. I’m simply taking the long-term interest rate on treasuries of 3% and adding a 4.5% market risk premium. For growth, we’ll use 3% as a baseline. Determining the correct required return and growth assumptions is difficult and these numbers could be argued. That said, if we simple steady state discounted cash flow model the fair PE multiple would be (1+g) / (r-g) = 22.88. This is very close to the PE multiple the market was trading at in December.
Coronavirus Shock Assumptions
We need a way to model the impact of Coronavirus on earnings. There has been talk of various recovers, such as a rapid return to growth (‘V’ recovery) and more drawn out ‘U’ type recovery. Earnings estimates for Q2 suggest that we will get a drop of 40% year over year. For the year, the current consensus seems to expect a 20% drop in earnings from 2019.
Using a discounted cash flow model and various recovery scenarios, I estimate the ‘fair value’ for the stock market. I assumed a 20% shock as well as a 30% shock and then look at how the fair value changes base don the number of years to get back to 2019 earnings. For example, if we assume 20% shock to earnings in 2020, earnings would need to increase 25% in 2021 to return to the 2019 level of $139.47 / share. If the recovery took 2 years, the growth rate would in earnings from the 20% shock would need to be 11.8% for two years running. Following the high growth recovery period, we then assume that earnings would go back to the steady state growth model of 3%.
Model Graph
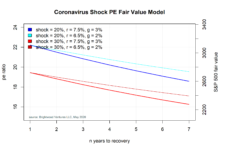
The next chart shows for curves. Let us start with the thick blue and thick red lines. The x-axis shows the number of years to recovery. They Y-axis on the right shows the fair PE multiple. They Y-axis on the right shows the fair S&P 500 level. The blue line represents a -20% shock to earnings in 2020. The red line represents a -30% shock to earnings in 2020.
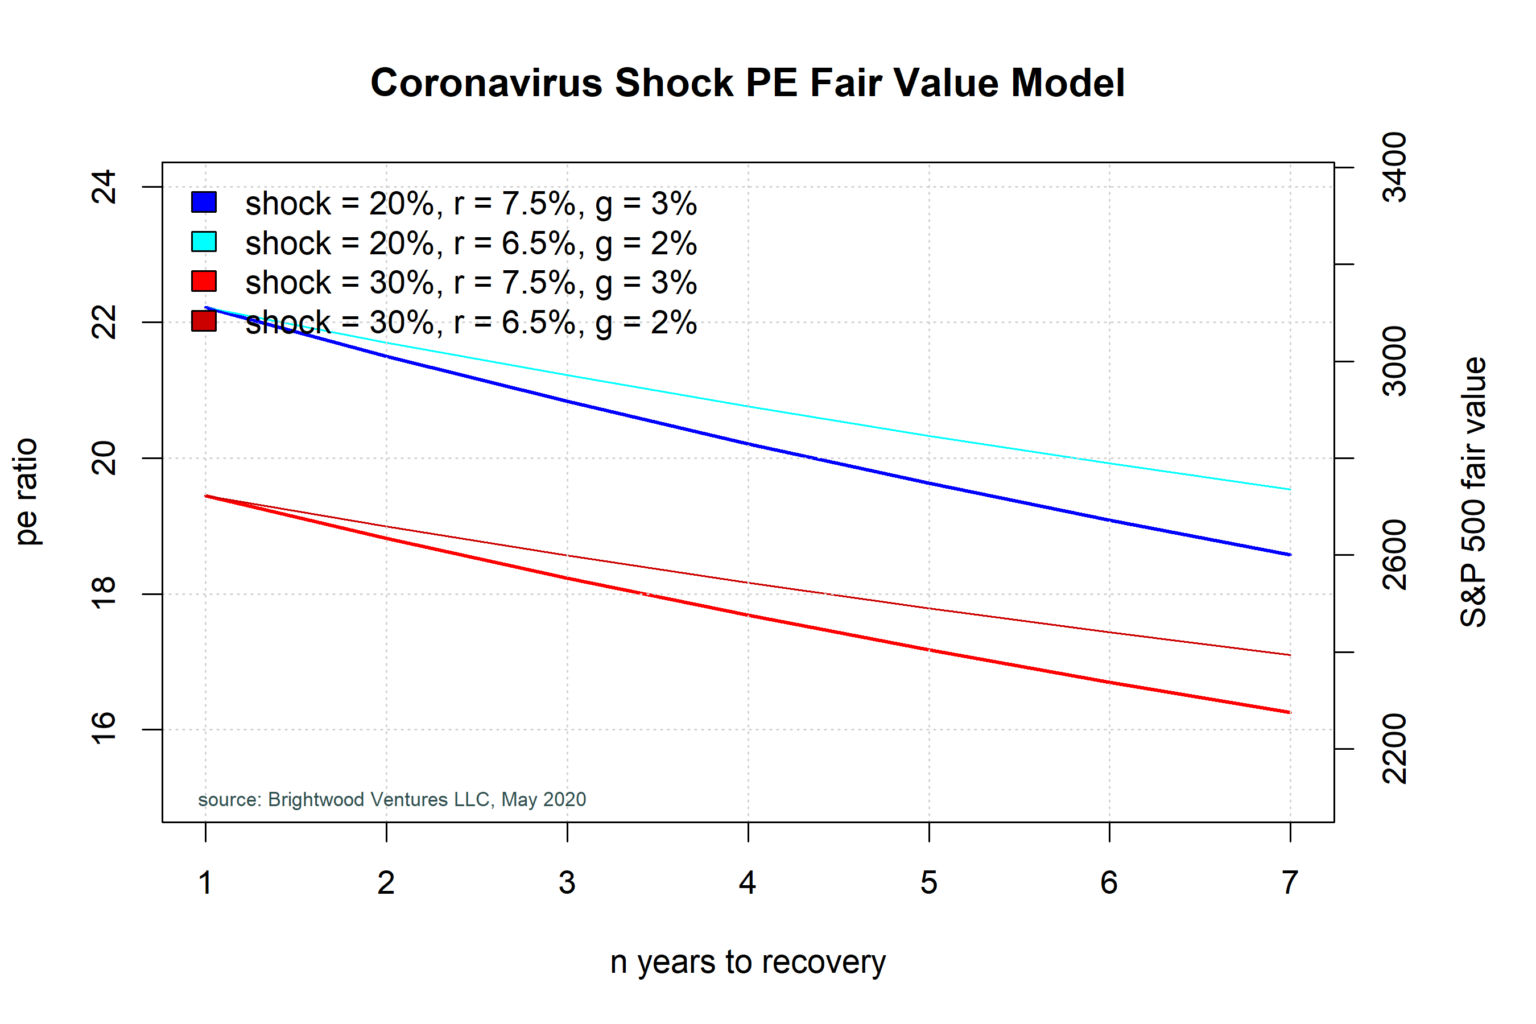
Looking at the think blue line, as expected, he longer the recovery in earnings takes, the lower the fair value for the market. If the US could recovery all of the lost earnings in just one year, the fair multiple would be over 22 x. As of today’s close, the S&P 500 was trading at 2940. That is a multiple of 21 x trailing 2019 earnings. If earnings drop 20%, the forward PE for 2020 jumps to 26.3 x.
With the market trading at 2940, if the economic shock is just 20% and the recovery takes just 2 year, the market would be considered fairly priced.
30% Shock Scenario
The challenge for investors now is that earnings are extremely difficult to forecast. Most companies have stopped providing guidance for the full year. In addition, the rate at which the economy will re-open is uncertain. Finally, even when the economy re-opens consumers and businesses may be less aggressive in spending. Based on April data, the US unemployment rate is 14.7%. The CBO is projecting 10% unemployment in 2021.
It seems reasonable to assume that a deeper shock of 30% or greater is equally likely to occur. I have plotted a 30% shock scenario (red curve).
Long Term Outlook
What are the long-term impacts to the Federal Reserve easing rates and the huge fiscal stimulus being provided by the Government?
Interest rates for government bonds have dropped significant. It seems very likely that we will be in a low rate environment for some time to come. If so, it is possible that the required rate of return is reduced. This follows a model where the stock market required return is built from bond interest rates plus an equity risk premium.
Ken Rogoff at Harvard has studied the impact of DEBT to GDP on economies. Countries with high debt tend to have reduced GDP growth going forward.
If we were to take the previous model and reduce both the required return and the growth rates down by 1%, we can see the impact to the fair value analysis. With reduced growth, the PE fair value is reduced. On the other hand, with reduced required return, the fair value PE would increase. From the ‘cyan’ and ‘dark red’ lines, we can see the impact of lower return and growth to the previous 20% and 30% shock models.
With the Fed cutting rates and pumping liquidity into the market, there has been a huge increase in the money supply. There is a strong argument to be made that the Fed easing and fiscal stimulus is helping to prop up the stock market
Conclusions
Using a discounted earnings model, assume we will have an earnings shock of 20 – 30% in 2020 and a three-year period to get back to 2019 earnings level, I would put a ‘fair value’ on the S&P 500 of 2,542 – 2,905.
Currently, client portfolios are overweight in cash. Before increasing stock exposure substantially, I am looking for clarity in Q2 earnings (in July and August), as well as continued progress in test kits and eventually a vaccine.
I think there is a better than 50% chance the market will trade again in the 2500 – 2600 range before the end of the year. If we get a buying opportunity like this, we may take advantage of that. In the meantime, with the market trading at 26.3 x projected 2020 earnings patience seems to be the prudent course.