According data from the Conference Board released November 28, consumer confidence rose sharply in November and has reached its highest level since November 2000. The reading for November came in at 129.5 (1985 = 100).
“Consumer confidence increased for a fifth consecutive month and remains at a 17-year high (Nov. 2000, 132.6),” said Lynn Franco, Director of Economic Indicators at The Conference Board. “Consumers’ assessment of current conditions improved moderately, while their expectations regarding the short-term outlook improved more so, driven primarily by optimism of further improvements in the labor market. Consumers are entering the holiday season in very high spirits and foresee the economy expanding at a healthy pace into the early months of 2018.”
22.4 percent of consumers said they expect better business conditions in the next six months. This is up slightly from 22.1 percent in October. 20.1 percent of households expect incomes will rise in the next six months.
What Does This Tell Us About The Economy?
There is some debate among economists as to whether consumer sentiment is a leading, coincident or lagging indicator of the economy. The Conference Board includes the University of Michigan sentiment indicator in their Composite Index of Leading Indicators. Furthermore, many consider the stock market itself as a leading indicator for the economy.
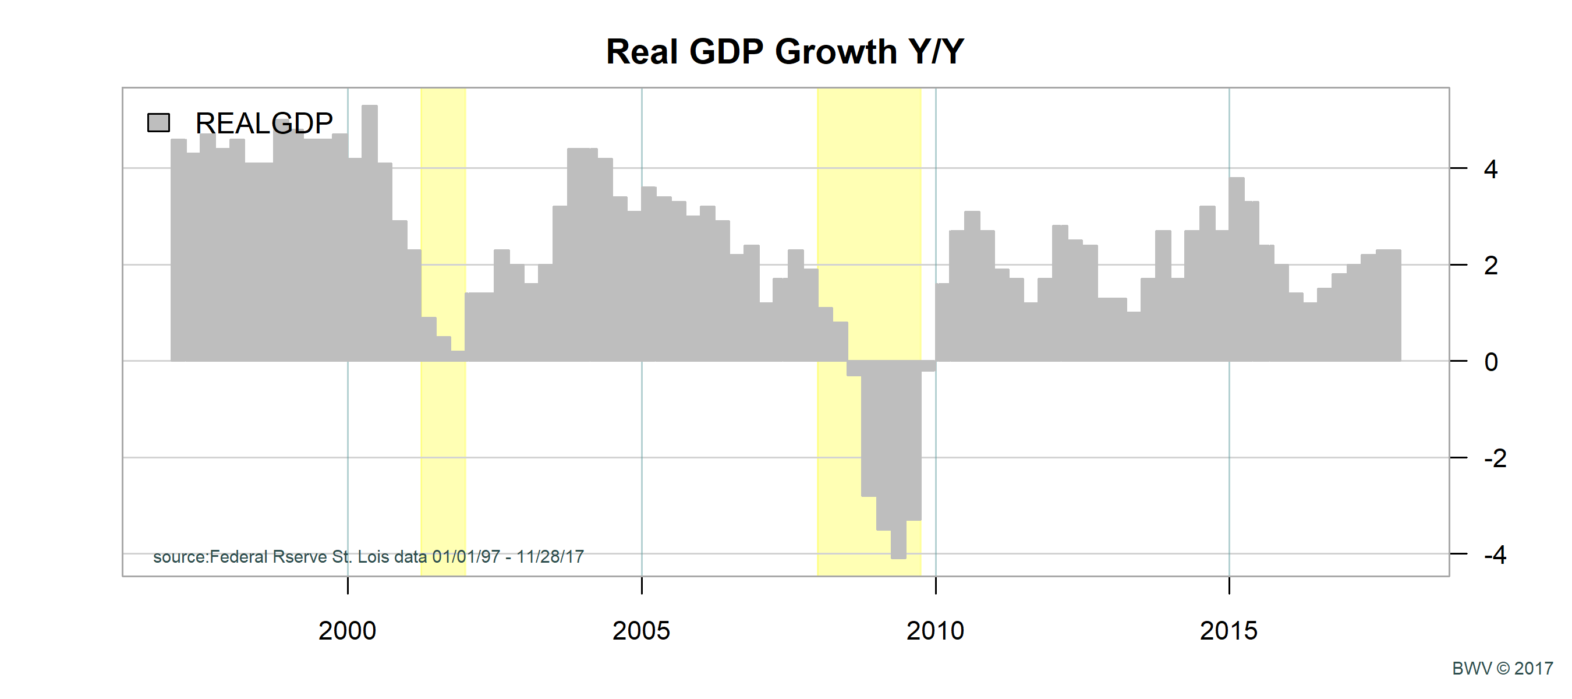
In the graphs below, I charted the Michigan Consumer Sentiment Index data along with the S&P 500 Index from 1997. The second graph shows real GDP growth year over year, with seasonal adjustments. The yellow shaded regions are economic recessions.
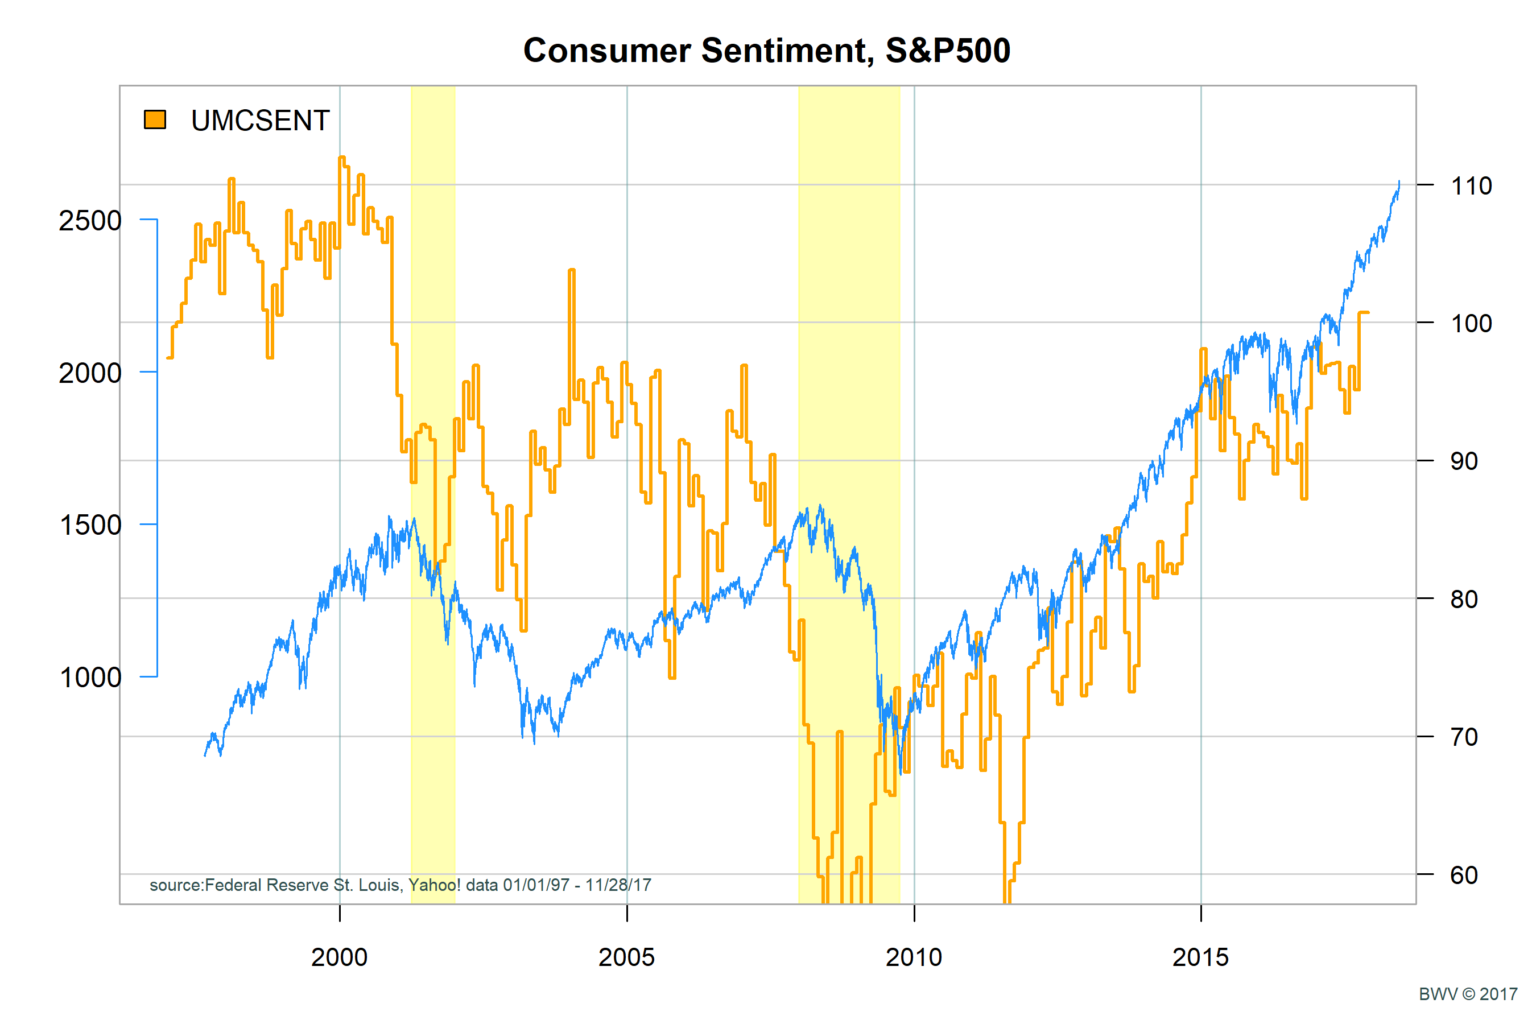
Let’s look at the last two recessions. The market dropped by roughly 15 percent in the fourth quarter of 2000. Sentiment peaked in June at 92.6 based on the University of Michigan Consumer Sentiment Index, but not until November according to the Conference Board index. The recession started roughly at the same point with recession signaled in first quarter of 2001. In the case of the 2007-2008 market decline, the University of Michigan index peaked in September with a reading of 83.4. The market peak was in early October.
Should This Change our Outlook for Stocks?
It is important to note that there is some lag in GDP and consumer sentiment reporting data. We have only looked at the last two recessions so it is not possible to draw high confidence conclusions about whether consumer sentiment or GDP growth are good leading indicators. From the graphs above, we can see a general pattern which shows consumer confidence peaking with stock prices. As the business cycle moves from growth to recession, consumer sentiment confirms what is happening.
According to Morningstar, the price to prospective earnings ratio for the S&P 500 companies is currently 21.15. The real growth rate in the economy is just over 2% and inflation is in check for now. We think it is prudent to maintain a heavier weighting in quality stocks (these stocks perform relatively better in weak or declining markets). We also believe dollar cost averaging any new funds invested into the stocks is wise.