
The Federal Reserve has been signaling that it expects to raise interest rates based on improvements in the economy. The exact timing isn’t clear and the Fed has indicated that they will be data driven. Should you be concerned about how any rate increase will affect your portfolio? In this article, I will examine the historical impacts on the US market based on the first rate hike from the period from 1982 to present. Of course past history does not create certainty about the future. It is important to look at other variables such as market valuation, economic growth and corporate earnings outlooks. Based on the historical data, interest rates and market valuations, conditions suggest that excessive fear may be unwarranted.
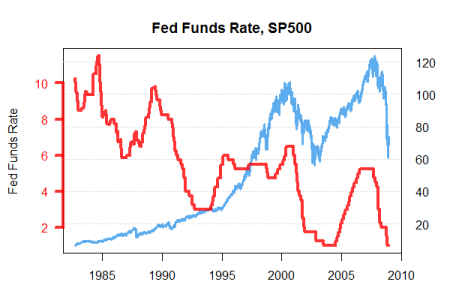
For this analysis, I used the Fed Funds Target Rate. The historical data shows 12 rising interest rate regimes. During the period, The Fed Funds Rate ranged from roughly 10% down to 1% when the data series ended. The current effective rate is .12%. The figure on the right includes the S&P500 total return which includes dividends. Next, I took the 12 instances of first rate hike rises and plotted the S&P500 total returns in the days following each rate hike.
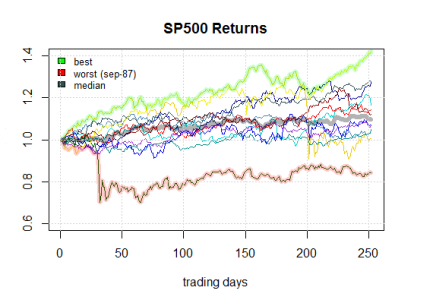
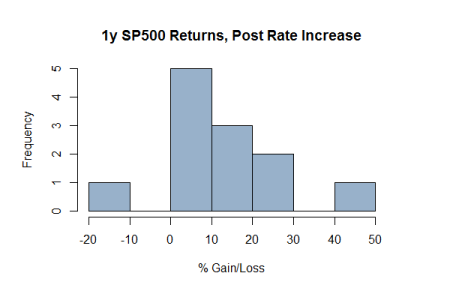
From the figure we see equity return nomalized to a price of 1 on the date of first interest rate hike in the series. For example, the first rate hike occurred Mar 31, 1983, and the last increase was Jun 30, 2004. Next we focus our attention on 250 days after the rate high (with 250 trading days in the year, this is approximately 1 year after the rate hike). In addition to the 12 series, I added highlights for the ‘best’ and ‘worst’ series as a composite. Also, I added a plot for the ‘median’ of the series. Of the 12 first rate hikes, 9 of the 12 hikes resulted saw positive one year S&P500 total returns. Two instances were just slightly negative at -1.1% and -.5% (April ’86 and Feb ’94, respectively). The median total return for the series after 250 trading days was approximately 9.7%. Why don’t higher interest rates drive the market lower? After all, higher rates should mean a lower value of future earnings, right? The general view on why markets seem to respond favorably to interest rate hikes is that 1) the market has anticipated or built in an expectation of higher rates prior to the rate hike, and 2) raising the interest rates is seen as a sign by investors that the economy is improving.
The series with the worst performance occurred after the Sept ’87 rate hike. Roughly a month and half after the initial rate hike the market fell ~30%. For the 1 year period after the hike, the market finished down 16% even after accounting for dividends. 1987 was a volatile time for the market. The market peaked at 336.77 on August 25, just 7 days before the rate hike announcement. By Sept 3rd, the market was off 5% from it’s peak. It is instructive to look at market valuations during this period and compare that to where we are today. Using data from Prof. Robert Shiller we can compare valuations and interest rates during 1987 and the current market state.
The PE ratio for the S&P500 in Sept ’87 stood at 17.09 vs. today’s PE of 20.5. While at first glance, some may be worried about today’s PE multiple from a historical perspective, we need to look at it in the context of valuation given interest rates. First, lets invert the PE and use the earning yield. So for 1987 we had an earnings yield of 5.8% vs. the current earnings yield of 4.8%. Let’s compare these yields to 10Y Treasury Notes. In Sept of 1987, the 10Y was yielding 9.42% vs today’s rate of 2.16%. In ’87 the stock market yield was roughly 3.6% below the rate you could receive on safe government bonds. Today, the market is yielding a higher rate than the 10Y by 2.6%. Given a substantially lower interest rate environment we would anticipate a lower expected return then in ’87. Although the current PE level is high relative to historic levels, when we look at it in the context of lower interest rates and slower growth. In this light, I don’t find the current level to be substantially out of line as they were in ’87. As a result, I don’t anticipate making any major tactical asset allocation changes to our model portfolios unless economic or market conditions change dramatically from here. (For additional analysis on my expectations for US Market Returns see: US Market Expected Returns