S&P 500 earnings estimates for 2021 and 2022 continue to look very strong. Average earnings growth from 2008 – 2019 averaged just over 10%. Earnings forecasts from 2019 through 2022 are forecasted to grow at rate of 12.3%, including the pandemic dip. This is based on S&P Dow Jones estimates for the S&P 500 companies.
Earnings Bounce Back
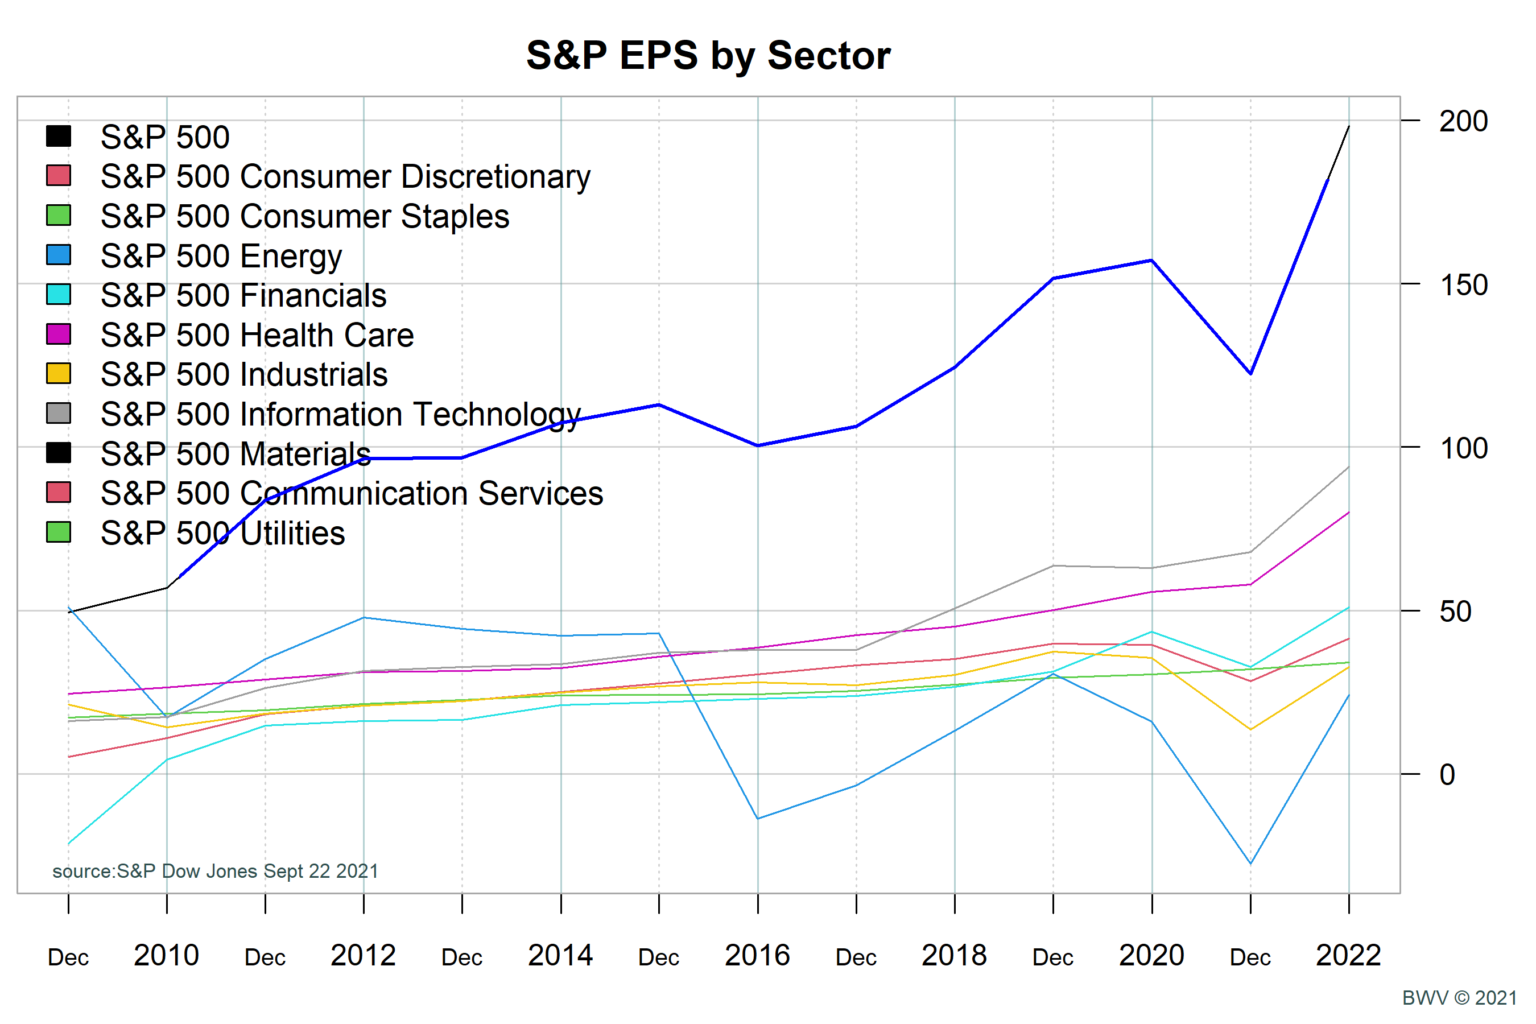
The recovery in operating earnings for S&P 500 companies has been nothing short of spectacular. The chart below shows operating earnings by S&P 500 sector since 2008. Operating earnings fell 22% in 2020. 2021 forecasts are $198.22 or 26.2% above 2019 levels. This is 12.3% growth, close or roughly 2.3% higher growth than the pre-pandemic average growth rate.
Price to Earning (PE) is Elevated Compared to Recent History
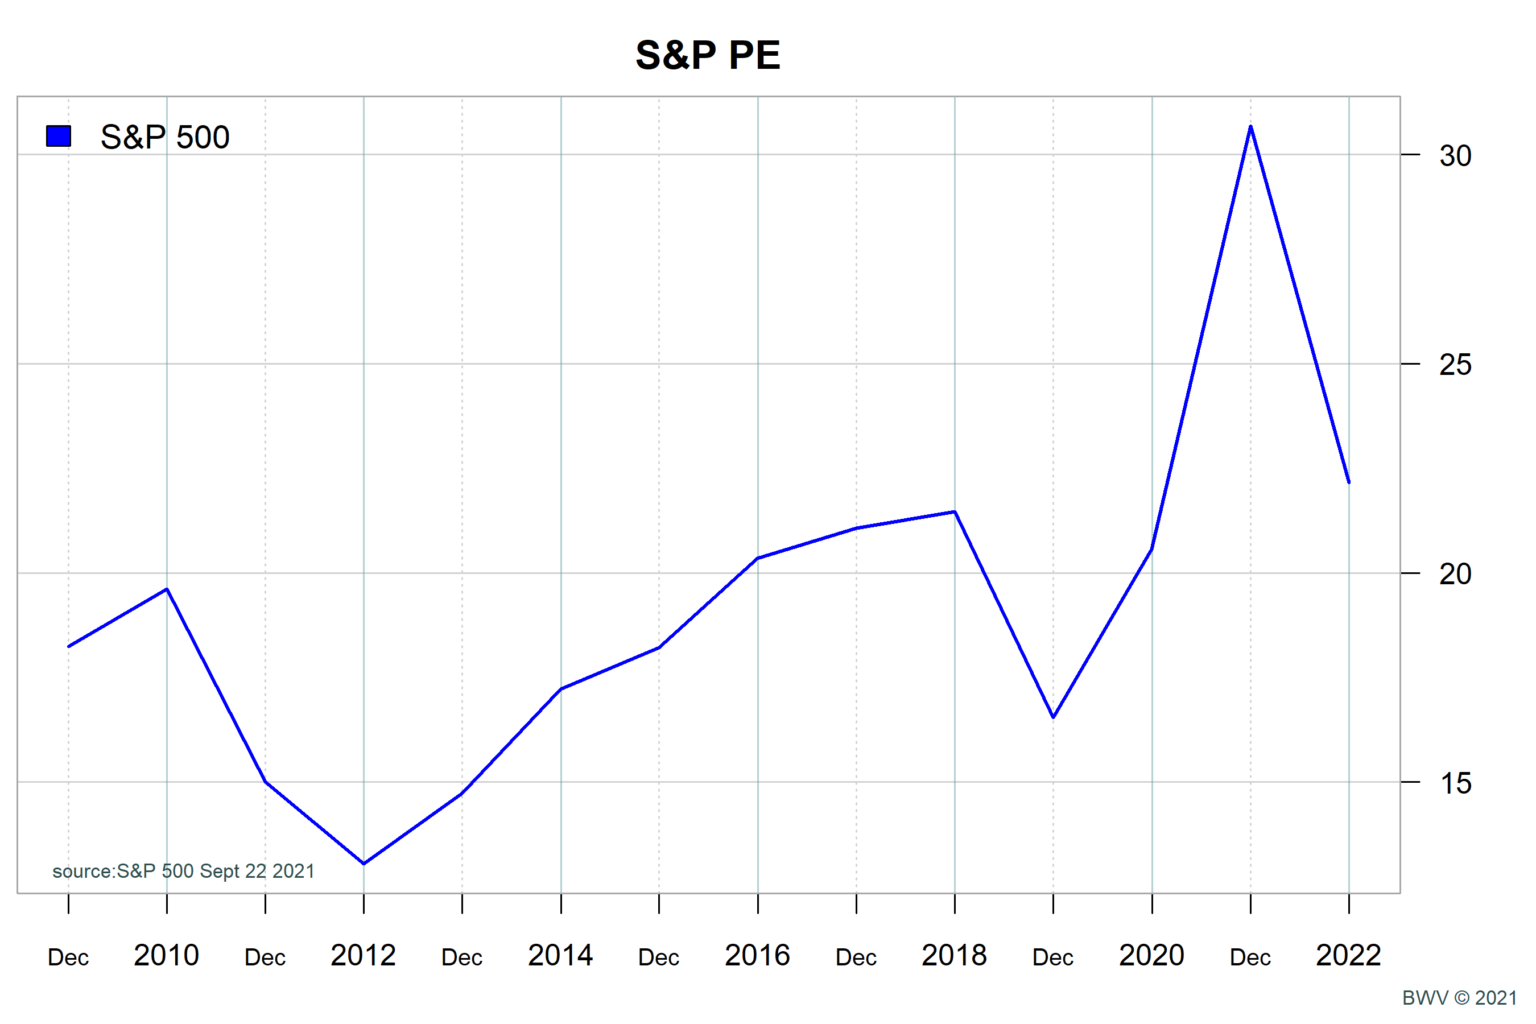
Plotting the PE based on operating earnings, we see that the PE based on year-end earnings has been rising steadily since 2008. Based on 2021 estimates, the PE ratio is 22.16. The average operating PE ratio for 2008 – 2019 was approximately 18. On a historical basis, the market is at the high end of the PE range.
Although elevated, the operating PE ratio doesn’t give a complete picture. As important as the PE is, the interest rate environment plays a huge role in pricing. Investors expect a higher return from stocks then can be achieved in bonds. This premium is referred to as the ‘equity risk premium’. When interest rates are high, we expect even higher returns from the stock market. When rates fall, we still demand a premium for stocks but overall return may go down. Over time, the premium return for the stock market has held more steady than the PE itself.
Equity Risk Premium
We can’t measure the equity risk premium directly, but we can estimate it. One way to do this is by looking at the earnings yield of stocks and compare that with the 10-year US government bond interest rate. In the chart below, we can see that the 10-year treasury rate in grey, while volatile, has been on a downward trend. In 2008-2010 we were in the 3-4% range. From 2010-2019 we were in the 2-3% range. The monetary actions by the Fed have driven the 10-year rates down to just under 1.5%.
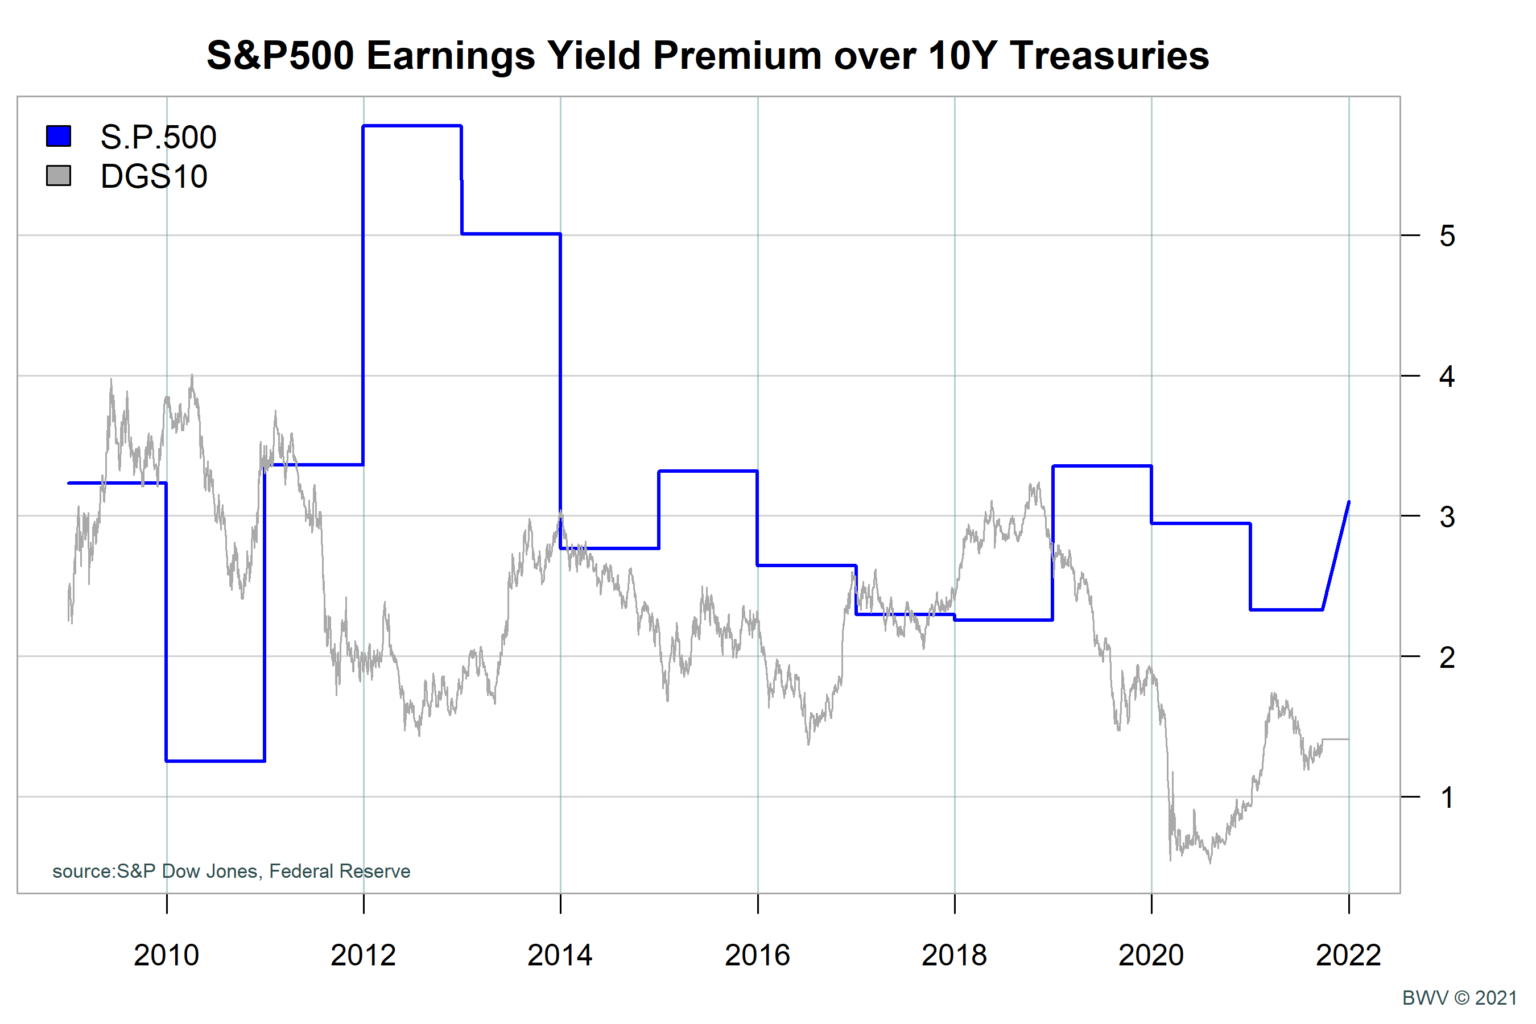
If we take the operating PE ratio of the stocks and flip it over, we get ‘earnings yield’. From this, we subtract the 10-year treasury rate. This earnings premium is roughly the extra return we could expect to earn by owning stocks (assuming rates stay steady and growth is zero). We can see from this chart that the equity premium has varied +/- right about at the 3% level. So, while the operating PE of 22 is above historical levels, given low rates the equity earnings premium is very close to the average over the last decade or so.
Conclusion
The pandemic recovery has been very strong. Low interest rates have helped to drive the price of stocks up. PE ratios are high compared to recent history. However, when we adjust the PE ratio to account for interest rates we are seeing that the earnings yield for stocks are largely in line with recent trends.