
Today I want to explore a very interesting post written by Philosophical Economics found here.
In the post, the author shows that there is a strong relationship between US investor equity allocation and future 10 year returns. In fact, he shows that past equity allocation explains greater than 90% of stock market returns. Using R programming, I have downloaded data from the Federal Reserve economic database, FRED and reproduced the relationship shown by Philosophical Economics.
In this article I will give a brief explanation for the relationship and the core economic rationale behind it. I find the strong relationship between equity allocation and future returns to be very interesting. I would caution against using this as a predictor for returns but, the discussion of the relationship between allocation and returns can give us a new perspective on equity valuation.
Introduction to the Model
The basic idea behind this model is to look at the total investor allocation to equities. The author breaks down financial allocation into cash, bonds and stocks. To estimate cash and bond holdings, the author noted that we can derive these values by looking at the liabilities of the five categories of economic borrowers: Households, Non-Financial Corporations, State and Local Governments, the Federal Government, and the Rest of the World. According to the author, “When these entities borrow directly from investors, the investors get new bonds to hold. When the entities borrow from banks, the investors get new cash to hold.”
Estimating the total value of equities is simply a matter of looking at current prices times the outstanding number of shares. As stock prices rise, all things being equal, investor allocation to equities rises. Finally, to calculate the equity allocation, we divide the equity holdings by equity + cash + bond assets.
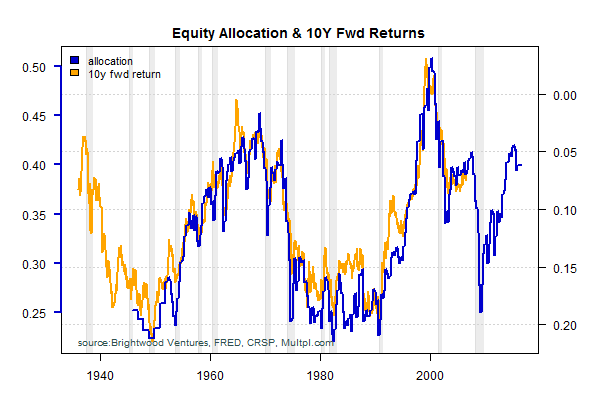
In this chart, I have plotted the US equity allocation and the future 10 Y stock market returns. The chart shows the equity allocation in blue and overlays 10 year S&P 500 returns in gold. Note that the scale of the left axis (blue) is the equity allocation. The return scale is on the right and it is inverted to better show the relationship between the two series. Currently, equity allocation for US investors is 40%. Note also that since we are plotting 10 year returns, the gold line only runs through 2005.
Data is available from FRED starting in 1945. We can see over time that equity allocation for US investors has ranged between roughly 25% and 50%.
Equity allocation over this period appears to be mean-reverting. By mean-reverting, we mean that the data tends to return to the middle of the range when it gets too high or too low.
I have highlighted recessions in grey. We can see that equity allocation % tends to be lower during this period. These tend to also be the point with depressed stock market prices. Note the equity allocation peaked around 2000 at just over 50%.
Statistical Significance
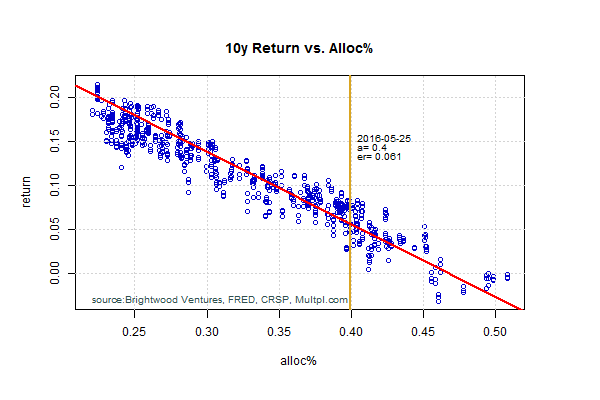
We ran regression analysis on the data and found similar results to those posted by Philosophical Economics. R-squared was 91.3% and this was significant at the 99% level. Past equity allocation explains over 90% of 10 year returns.
How does this compare to other models? One of the most commonly cited model the P/E model developed by Professor Robert Shiller known as the Cyclically Adjusted P/E (CAPE) ratio. That model is significant, but explains less than 50% of stock market returns.
The following figure shows just how strong the relationship is. On the x-axis we have the equity allocation and on the y-axis we have forward 10-year returns. I have included the regression line in red. The gold vertical line at 40% notes where we are today. Based on the regression, it would predict that we should expect 6.1% return over the next 10 years.
Economic Discussion
At the core of this model is the notion that cash, stock and bonds all have a supply-demand dynamic. Prices for stocks will rise when the outlook for the economic is strong as perceived by investors. When financial trouble strikes and investors become negative on stocks, the price naturally falls. Using this supply-demand model, we can say that the relative prospects for the asset class drive the equilibrium point. The price earnings multiple can vary over time based on investor outlook and relative value of cash vs. stocks vs. bonds.
How does this compare to other models such as CAPE? The CAPE model suggests that future returns can be explained by the cyclically adjusted PE ratio. Basically, 10 years of earnings representing an entire business cycle are adjusted for inflation and compared to price.
One of the key problems with the CAPE model is that it does not directly account for interest rates. The price we should be willing to pay for stocks should be somehow related to the current bond interest rates. The idea being that we should expect some premium for holding risky stocks compared to bonds. In the early 80s, treasury bonds were paying over 10%. Today they are under 2%. If stocks are valued based on the discounted value of future dividends and earnings, we should expect to see higher prices when interest rates are lower.
Conclusion
Based on historical data, US equity allocation and future stock market returns have been strongly related. The premise for the model is simple but powerful. Supply-demand dynamics drive investors to hold varying level of equities. The price they pay for stocks as measured by P/E does not necessarily remain the same over time. Relative return or safety for holding cash or bonds matters, unlike the CAPE model. Should we use this as a predictor for future returns? I would caution against relying on the model, but it a very interesting relationship I would not dismiss.