 • US stock market returns for 2020 by sector have ranged from -38% (energy) to +18% (tech).
• Sector returns are correlated with estimated earnings growth for 2020
• Current forecasts for earnings are highly uncertain given pandemic and lack of company guidance
• For these reasons, we are keenly focused on earnings reports that will roll out in the next 2-4 weeks.
Observing the wild swings in individual stocks and the stock market at large, one has to wonder if the stock market operates rationally. The economy and markets have a large number of forces influencing them, but in the long run earnings are what we buy when we invest in stocks or stock funds. There is no question that government stimulus and Federal Reserve programs are strongly influencing valuations as well, but for the time being let’s set that aside and focus on the fundamentals.
The S&P 500 total return for the first half of the year is -3.2%. However, return by sector varies significantly. The worst performing sectors are Energy and Financials. The Energy sector is down 38%, largely driven by the large drop in oil prices combined with the economic slowdown. The Financials sector (down 20%) is primarily made up of the large banks, the largest being JP Morgan. The banks are under pressure because the loans they have made are under pressure of default.
Meanwhile, the top performing sectors for the year are Technology, Consumer Discretionary (cyclical) and Healthcare. Technology stocks are up almost 18% for the year. Healthcare stocks are up 3.2% and Consumer Discretionary (cyclical) is up 13%.
Within each sector we also have a wide dispersion of gains and losses. For example in Financials, Wells Fargo (WFC) is down over 50%, while Progressive Insurance is up 9.7%. In Technology, Microsoft is up 31% while HP Enterprise is down 39%.
If markets are rational and earnings matter, we should be able to see some relationship between returns for the year and the change in earnings. Let’s take a look at the earnings growth and returns for the US stock sectors as defined by Standard & Poors. In the chart below, we have estimated operating earnings growth vs. the year to date return by sector. The earnings growth number is the current earnings estimate for the companies in the sector for 2020 divided by the actual operating earnings delivered in 2019.
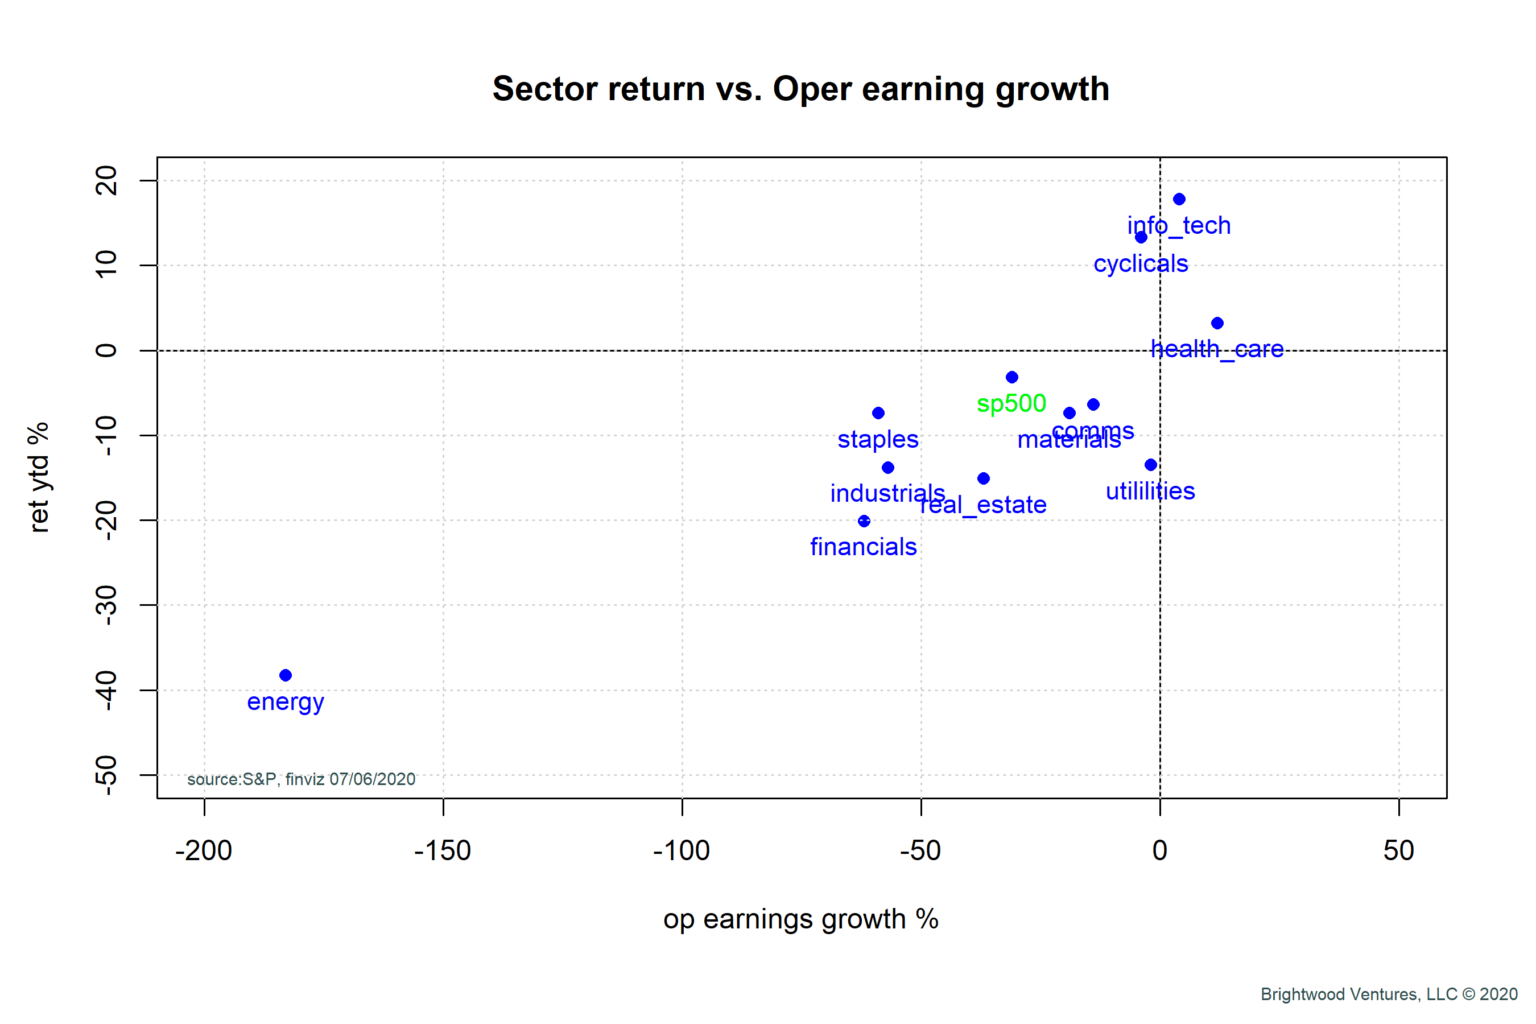
Looking at the x-axis, we see a wide range of estimated earnings vs 2019 actuals. Estimated earnings for the Energy sector are expected to decline 180% from 2019. Meanwhile, Technology stocks are expected to grow earnings by 12%. When we look at the data by sector, we can see a relationship between the expected operating earnings and the returns achieved so far this year. Using this simple graph, it appears that the market is attempting to price the stocks within each industry group based on the estimated change in earnings for the year.
At this point we might be tempted to say this all looks good, the market seems to be pricing changes to earnings based on the real economy. Unfortunately, life is not so certain. The earnings estimates are highly suspect now. First, most companies in the S&P 500 are not providing forward guidance for the year. This means that the earnings estimates come from analysts without much input from the companies themselves. Having spent the better part of my life working in high technology companies, my experience suggests that companies are having a difficult time themselves forecasting the earnings. It is even more difficult for the analysts to do so.
Nike is a very good example of the problem. Nike reported results for quarter ending May 2020 on June 25. (This is Nike’s fiscal quarter and doesn’t align with standard calendar quarters). Nike sales declined 38% year over year. Nike reported a loss of $790 Million or -$.51 / share. How did this compare to analyst estimates? Analyst mean estimate was $.31 / share profit! Worst yet, every single analyst predicted earnings greater than Nike delivered. The next day, Nike stock dropped 7% on the surprise. [DISCLOSURE: Author and certain Brightwood Ventures LLC clients own Nike directly or indirectly through stock funds. Positions were reduced April 17th on valuation concerns].
Conclusions
The market is attempting to price future expected earnings. Returns aggregated by sector do show some relationship between earnings estimates and change in price since the beginning of the year. However, earning uncertainty is very high. It is possible that analyst estimates may be optimistic. The next 2 – 4 weeks will give us much better understanding of the true picture.