
We are underweighted in developed country international stocks vs. US stocks. There are a number of factors that have led to this underweighting. In this article I’d like to discuss the relative value of US stocks to international stocks. The focus here is on developed country stocks which excludes emerging markets.
Relative Value Analysis
Our focus here is on current and justified PE ratios for US vs. international stocks to demonstrate how we can compare PE ratios based on different growth expectations. When we talk about a ‘justified’ PE ratio, we need some kind of valuation model as a baseline measurement estimate.
For this example, I am going to use a simple growth model that starts with the premise that the value of a company is based on its current earnings and further assumes that those earnings will grow at a constant rate forever. Furthermore, I will assume that the required return we need for both US and international stocks is fixed at 6.75%.
Using discounted cash flows, the present value of a stream of earnings, growing at a constant rate and discounted with a required return can be stated as:
Price = E * (1 +g) / (r– g)
Where:
e = earnings per share
g = expected growth in earnings
We can restate the equation in terms of a P/E ratio as follows:
P/E(justified) = (1 + g) / (r – g)
Model Discussion
This earning growth model can help us to understand how to value individual stocks or a collection of stocks that are growing at different rates. Let me make a few observations before we look at US vs. international stocks. From the equation we can see from the denominator that if the required rate of return goes up, we would find a lower justified PE. Assume for the moment that growth is zero. The justified PE would be 1/r. Let’s say a stock has a PE of 20. The earnings yield is 5%. If we required 5% return than we would be willing to pay $20 for each $1 in earnings. However, if we required 10% return, we understand intuitively we would be willing to pay less for the same $1 in earnings. We would only be willing to pay $10 for the same stock, if our required return was 10%.
Now let’s look at growth. If we focus on the denominator again, we find the term ‘r – g’. The growth term will tend to reduce the denominator. With a smaller denominator, the justified PE will go up. Intuitively, we can see that if one company is growing earnings faster than another, we would be willing to pay more for it.
Current PE Ratios US vs. International
Now let’s look at some data for the US market (using the iShares S&P500 fund ‘SPY’) and the International Developed markets (using iShares EAFE fund ‘EFA’).
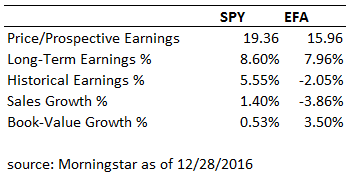
From the table above, the price per share for each dollar of earnings can be found in the top line. US market PE is 19.36 and International is 15.96.
The second line in the table provides the weighted average five-year estimate of earnings for the companies in each fund. Note that this number is higher than the GDP growth for either the US or international stocks. Long term analyst estimates start out very high and over time these estimates are ‘revised’ down. The third, fourth and fifth lines provide the growth in earnings, sales and book value over the last 4 quarters. We can see that earnings have grown in the US over the past year and they have fallen 2% in Europe.
Currently, some analysts are suggesting that international stocks are a good place to invest because the PE ratio is lower than in the US. While it is true that the PE ratio is lower, we need to look beyond the static PE ratio and think about how growth will impact the decision.
Implied Growth Rates
Before looking at forecasting growth, we can ask the question, ‘given the current price level for US and international stocks, what growth rate is implied by the price?’ To do this we use the equation above and insert the required return and the current PE and solve for ‘g’. When we use 6.75% for the required rate of return, we can estimate that the market price for the US market implied is 1.5%. For international stocks, the implied growth rate is .5%
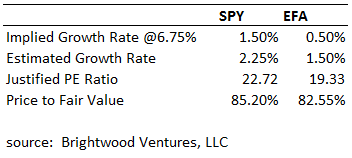
We can look to economists to help generate an estimate for the fair value of US and international stocks. For example, the latest GDP forecasts from the Worldbank from 2015 (data.worldbank.org) forecast US real GDP growth at 2.4%. The Worldbank forecast average for UK, German and France is 1.9%. For the estimates I use, I assume 2.25% for the US and 1.5% for international stocks.
Justified PE Ratios and Price to Fair Value
Using Brigthwood estimated growth forecasts we find the justified PE ratio for US stocks is 22.7 and for international 19.3. If we compare the current PE to the justified PE ratio we can see that the current prices are ~85% of fair value. It is important to point out that the model is very sensitive to growth estimates and required rate of returns. Also, we used a very simple model to derive price or value based on a constant growth model. That said, from the analysis, we can see that growth estimates matter and they impact the price we should be willing to pay for stocks.
Low PE ratios do not always mean good value!
In the case of internationals stocks, we are underweighted for several reasons. Relative value analysis shows that while international stocks have a lower PE ratio, the relative value is not materially different from US. Additional factors for underweighting international stocks include political risk in the EU and currency risk as the dollar continues to strengthen based on US growth outlook and Fed rate increases.