In the last several months, it would have been hard to miss the flurry of articles discussing the flattening yield curve and likelihood that a recession is near. Here are just a few examples, “The U.S. Yield Curve Is Flattening and Here’s Why It Matters”, “Replace Yield Curve as a Recession Predictor? The Fed Considers an Alternative”, and “That flawless predictor of recession and a bear market is wrong this time”.
Key Points:
• Historically, inverted yield curves have occurred prior to recession.
• However, on average the recession takes between 1.5 – 2 years to develop after the inversion.
• New models developed by the Fed and extended here improve the model accuracy.
• Currently, the probability of a recession in the next 12 months is low. This can change rapidly.
The Model in a Nutshell
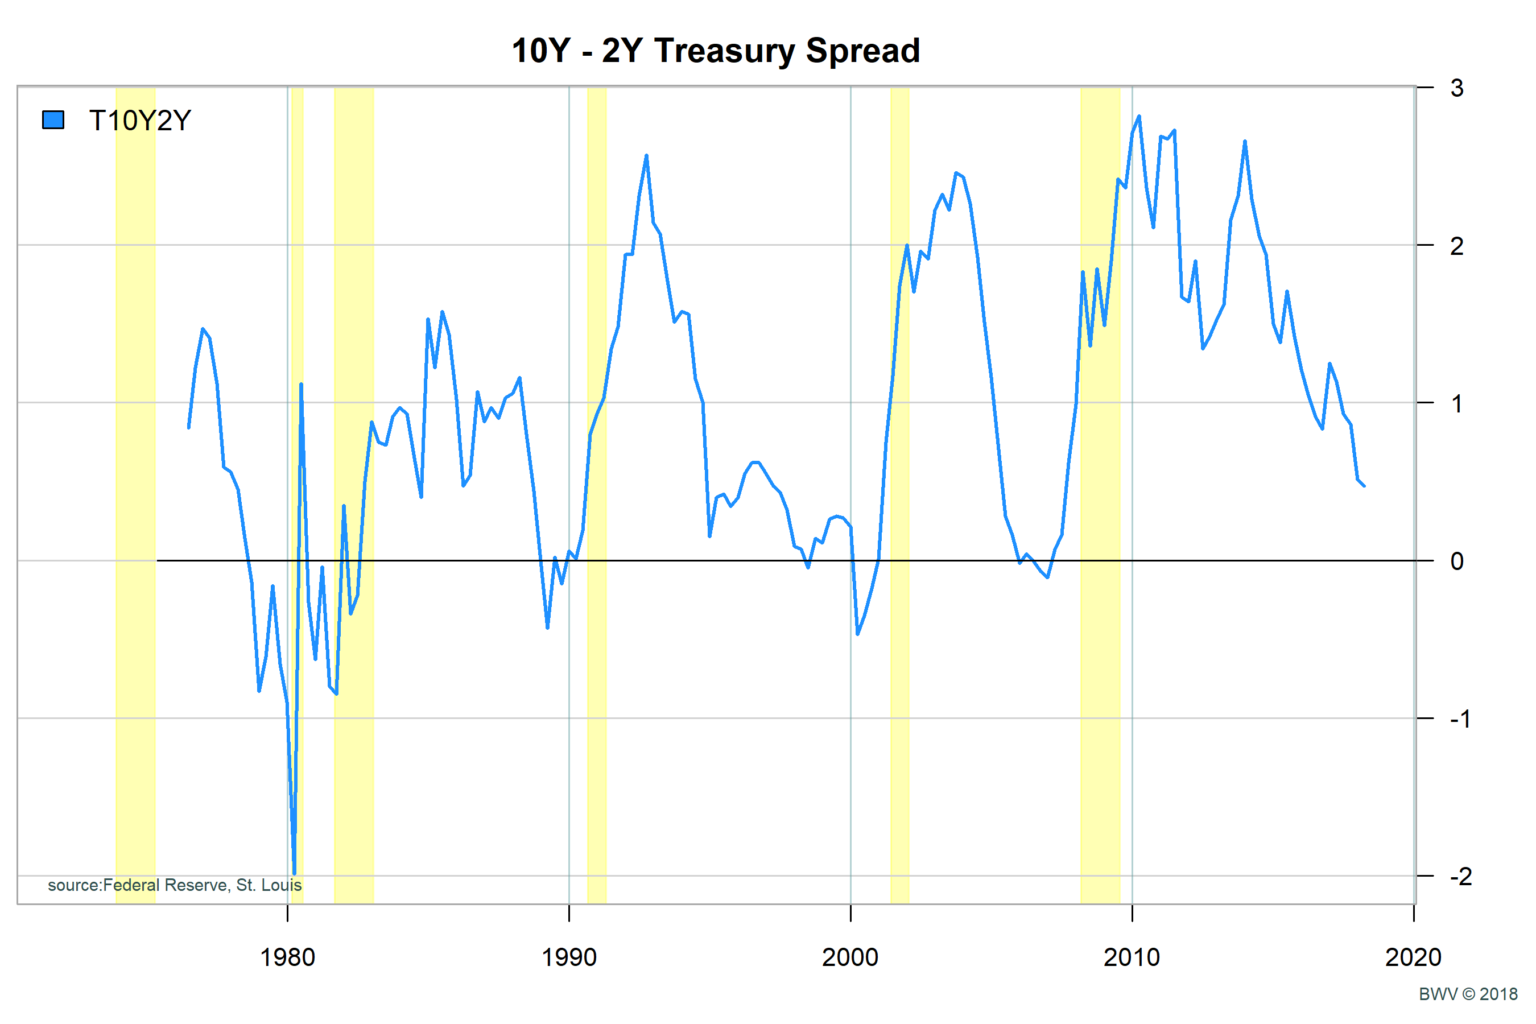
An article from Charles Schwab provides a good primer on the yield curve, “Don’t Fear The Yield Curve Reaper”. When interest rates on short term bonds (typically measured on the 2Y treasury notes) is higher than long term interest rates (typically measured on the 10Y treasury rate) the yield curve is said to be inverted. An inverted yield curve has tended to signal coming recessions.
The basic logic for why this works goes as follows. The economy tends to operate in a business cycle where we get periods of growth and decline. When the economy overheats, we get inflation. When we get inflation, the Federal Reserve raises rates to tighten credit and put the brakes on the economy. The idea with an inverted yield curve is that the market is expecting future rate increases at the short end of the yield curve. If short term rates rise above long term rates, we expect the economy to slow. When the economy slows, earnings growth declines and the market typically follow.
What are the Specific Limitations with the Model?
The biggest problem with using an inverted yield curve model to predict recessions is timing. According to the Schwab article, the average number of months from the point of an inverted yield curve to the point of a recession is 20 months. Even with improvements to the model that we’ll discuss later, the prediction window is something on the order of one year.
In addition, some argue whether the model would still apply in the current environment. In the Yardeni article noted earlier, Dr. Yardeni argues that low and negative interest rate policies of global central banks may be causing the curve to flatten, not excessive growth. US economic growth is robust, but not excessive. Inflation around 2 – 2.5% is not out of control.
New and Improved Federal Reserve Model
Given the problems with the current model, I started doing more research to see if we find something better. Interestingly, the Federal Reserve also has a very strong interest in improving the model. In the latest FOMC minutes from June, the following Federal Reserve paper was cited, “Don’t Fear The Yield Curve”, by Eric Engstrom and Steven Sharpe here.
I was able to download the data and reproduce the Fed model from the paper. I also tested a number of extensions and found some interesting results.
Points about the Fed Model:
• The updated Fed Model (Fed Mod) replaces the 10Y – 2Y spread with the 6 quarter forward rate premium on 3 month T-bills.
• Fed Mod also adds a term for the current 3 month treasury bill interest rate. The higher the short term rates, the higher the probability of recession.
• Fed Mod adds a term called ‘excess bond premium’. This term is thought to capture fear by looking at the credit spread on bonds an over expected spread given default rates.
6 Quarter Forward 3 month T-bill Rate Spread
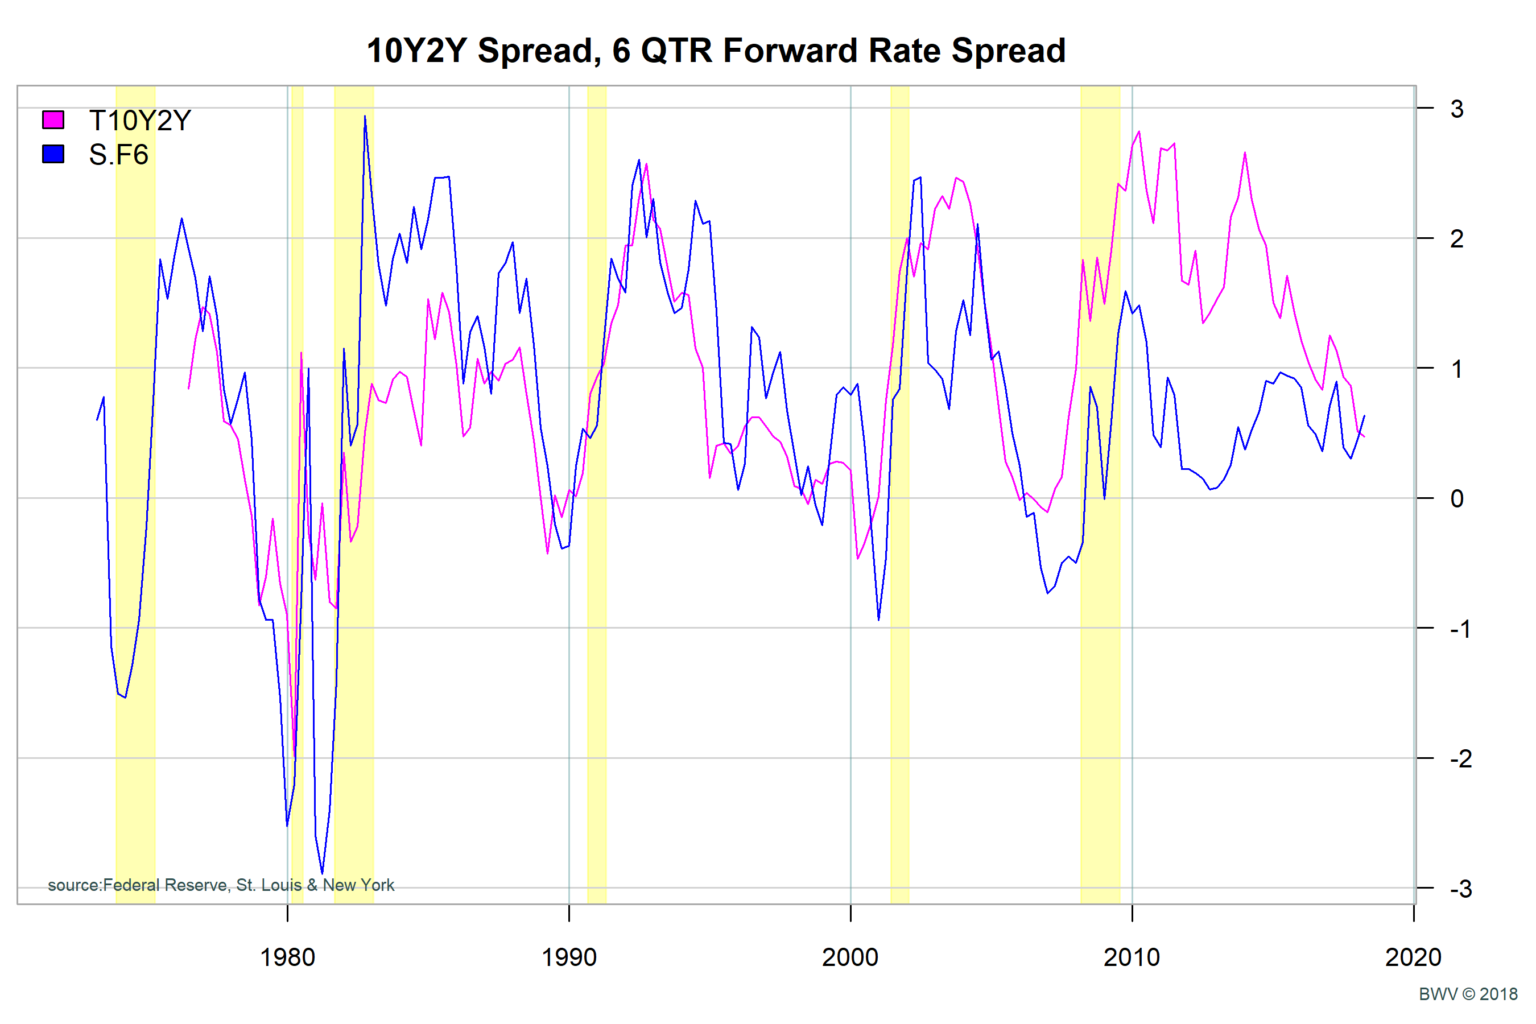
Fed policy has a large effect on short term interest rates. As such, there is a good argument to be made for using short term rates for the signal. Forward contracts can be used to derive the expected future interest rates. The authors of the Fed Mod used the forward rate 6-quarters in the future minus the spot rate for three month t-bills. Forward rates are not as easy to understand as simple treasury rates, and the data is harder to derive than the 10Y – 2Y spread. I include a plot with both the 10Y – 2Y spread and the forward rate premium. From the chart below, I would just point out that the two the two measures are pretty close to each other. However, we can see that the 6 Quarter Forward Spread (S.F6) is a bit sharper in the extremes.
Excess Bond Premium
The excess bond premium was described in the following Federal Reserve paper, “Recession Risk and Excess Bond Premium”. The Interest rate on corporate bonds (also referred to as ‘credit bonds’) includes a premium over risk-free treasury bonds. This premium is thought to capture information about investor expectations. The excess bond premium is essentially a measure of how much extra yield the market is demanding over a fair price. From the chart below, note that the EBP typically falls during economic expansion and typically spikes before recessions. From the chart we see that the excess bond premium actually falls below zero when the economy is running strong and stocks are doing well. As the recession approaches, the EBP changes direction and exceeds 0. Fear increase and the premium goes up. Investors demand higher return.
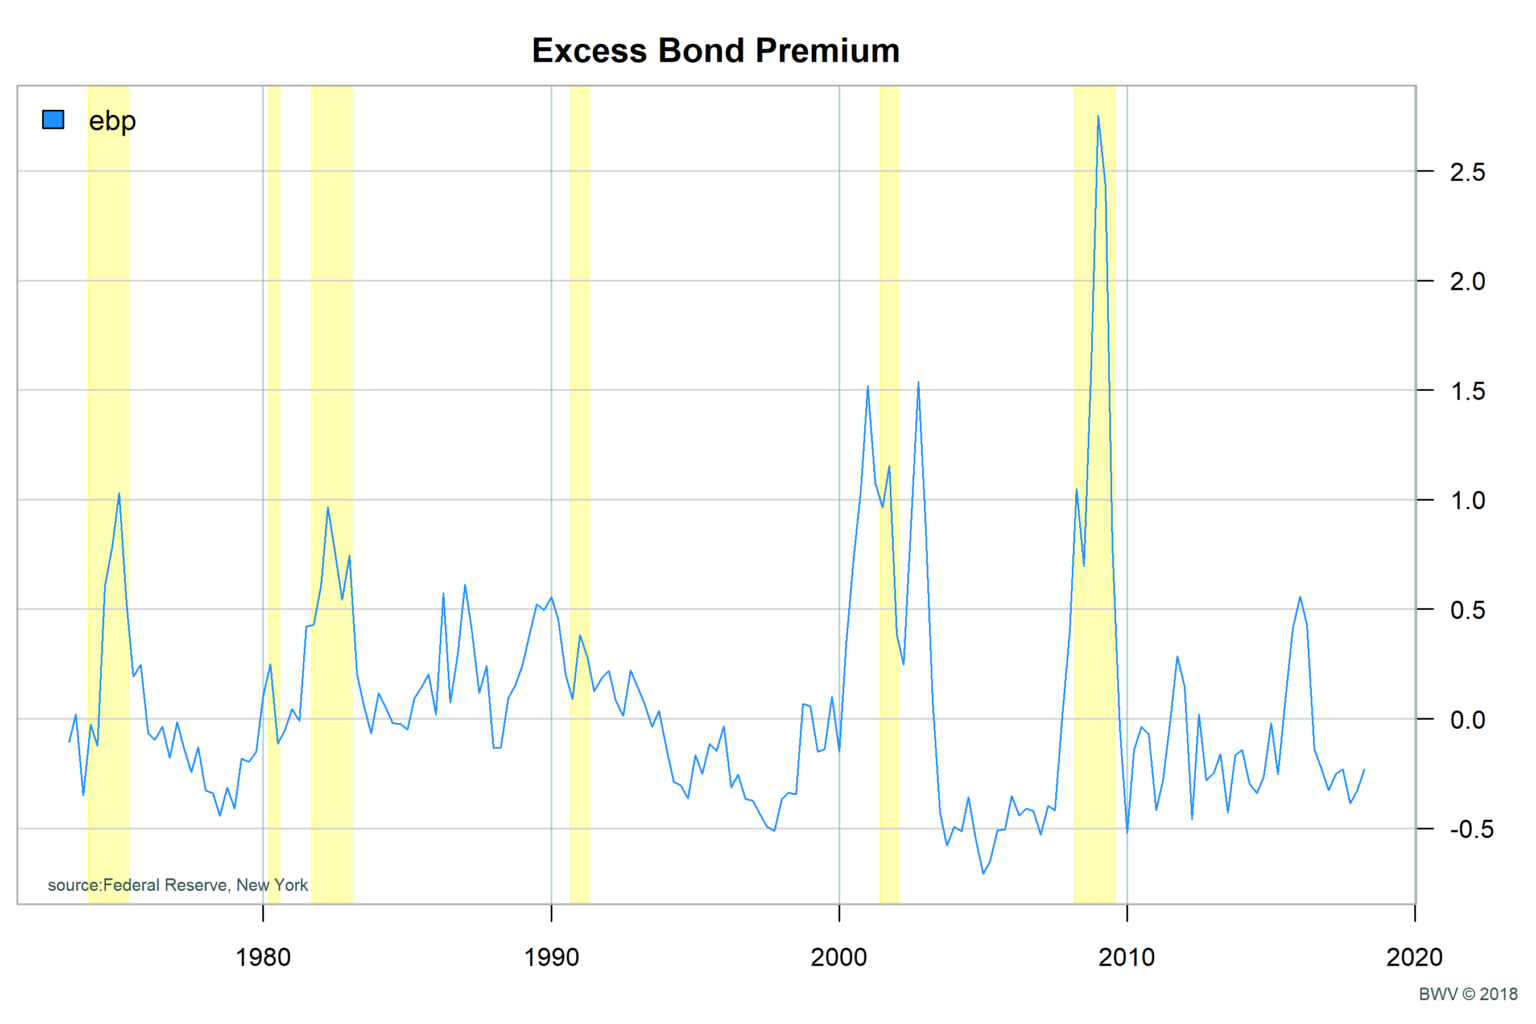
Interestingly enough, if you watch high yield bond prices you can get a pretty close idea of what EBP is doing. As EBP spikes, you should see junk bonds falling. Look at iShares JNK and you’ll see declines before market crashes!
Predicting Recession
Given the data above, I used statistical software (R with GLM binomial Probit model) to reproduce the Fed Mod. The statistical learning software model uses the data to predict the probability of a recession in the next 12 months. The chart shows the probability of recession for both the original Fed model using just 10Y – 2Y (Fed 10Y2Y) and the newer Fed Mod using the foward rates, the 3-month treasury bill spot rate and the EBP.
From the chart, note that the Fed Mod has sharper jumps in recession probabilities then Fed Orig. The additional variables have improved the model and the predictive ability.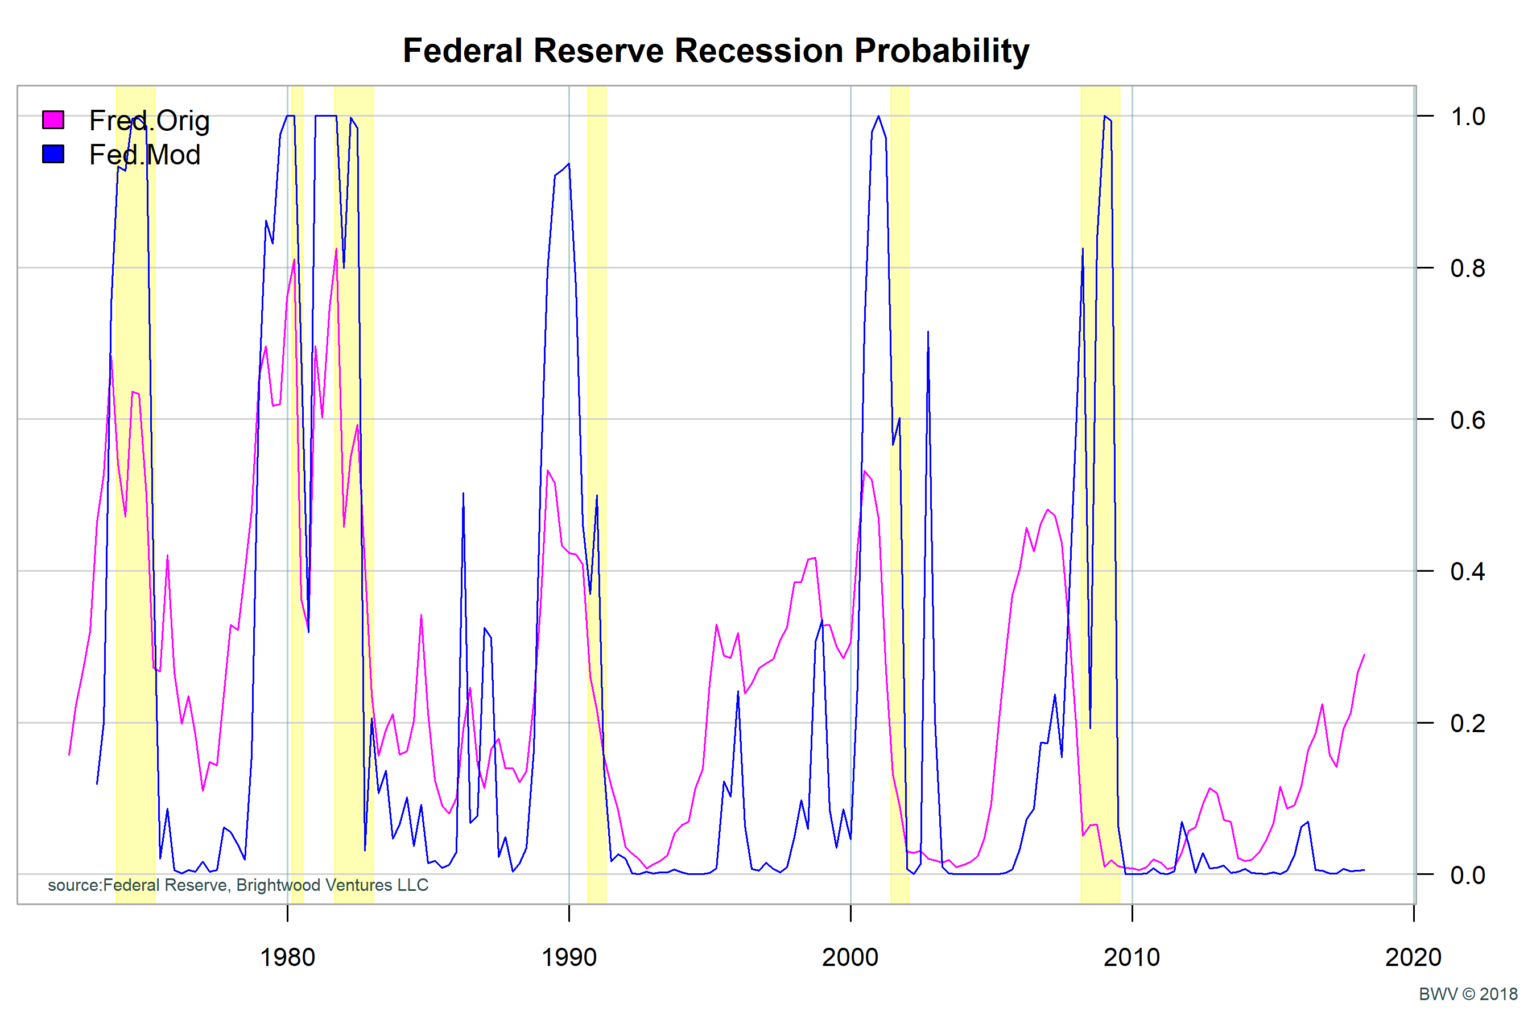
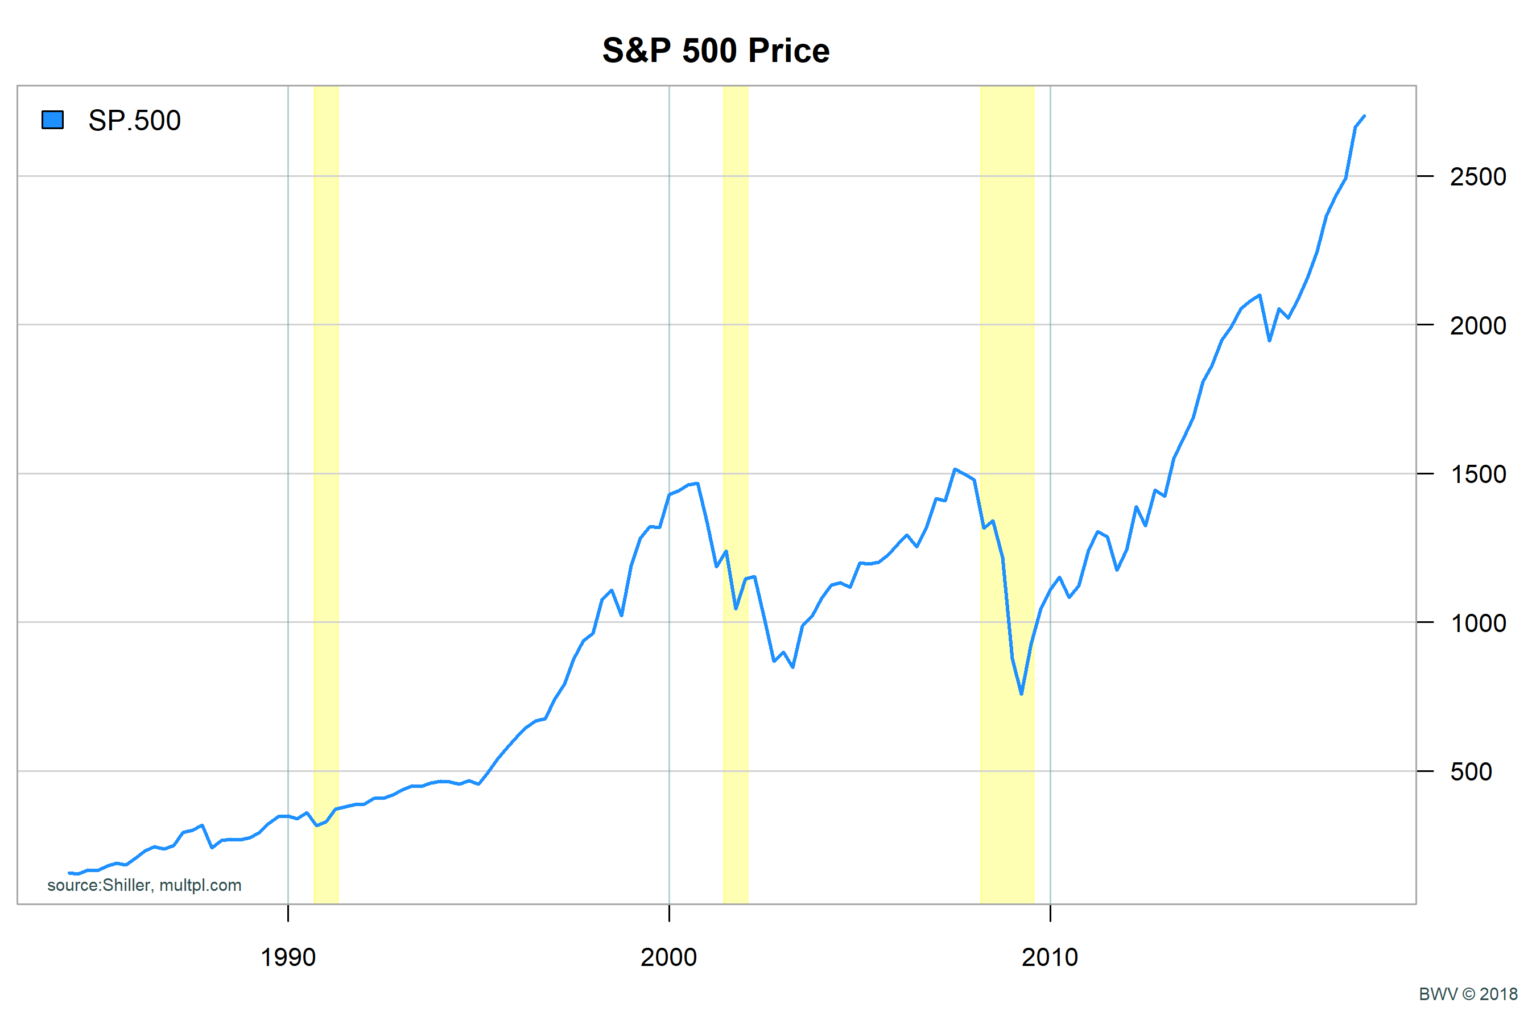
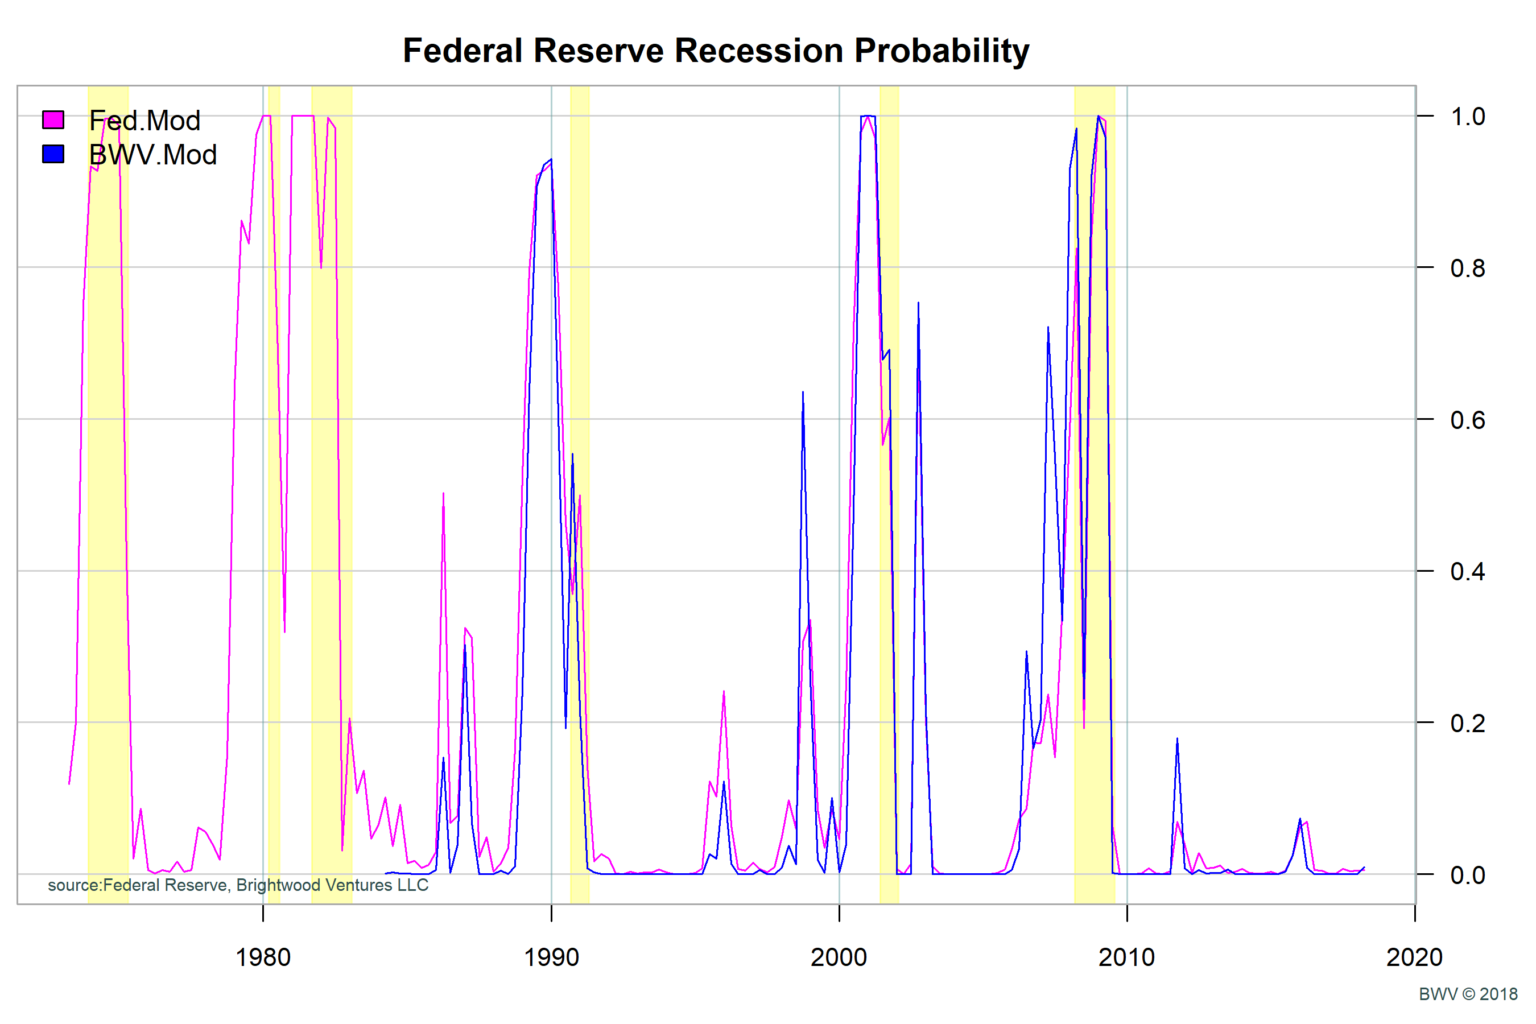
Do Stock Market declines help forecast Recessions?
Leading economic indicators include multiple variables. In fact, the Conference Board Leading Economic Indicators for the US (LEI) is comprised of ten components, including S&P 500 stock price. Stock market declines tend to precede economic declines. To test the idea, I created a variable for stock prices below their 50 day moving average and added that to the Fed Mod. When stock prices are below the 50 day MA, the signal is ‘1’, otherwise zero. I added this variable to the Fed Mod and ran another probit regression (call this BWV Mod). The addition of the stock signal was statistically significant! The resulting probability looks similar to that of Fed Mod in terms of sharpness with the addition of warning spikes prior to those found in Fed Mod. This model needs additional work, but from first analysis looks promising!
Conclusion, What Do the Models Predict now?
What we have learned is that the 10Y – 2Y interest rate spread does have predictive power when it comes to likelihood of a recession in the next 12 months. In addition, we learned that adding additional variables improves the model. Specifically, the Fed Mod replaced the 10Y – 2Y with short term 6-quarter forward rates, the spot rate on 3 month T-bills and the excess bond premium (EBP). In addition, I added the 50 day MA timing signal. All of these changes improve the model.
Most recently, the Fed Orig model had recession probability at 29%. However, with the updated Fed Model, the probability is very low. The Fed paper noted that the market is putting low odds on a recession in the next 12 months (based on this new model). The BWV Mod with the addition of the 50 day MA timing signal is also signaling low probability.
Market expectations can change quickly. Some have speculated that a trade war could be a catalyst for changes to credit spreads and an inverted yield curve. At this point, keep a close watch for declines in junk bond prices and stock market declines along with the 10Y – 2Y spread for clues that a shift in sentiment may be coming.
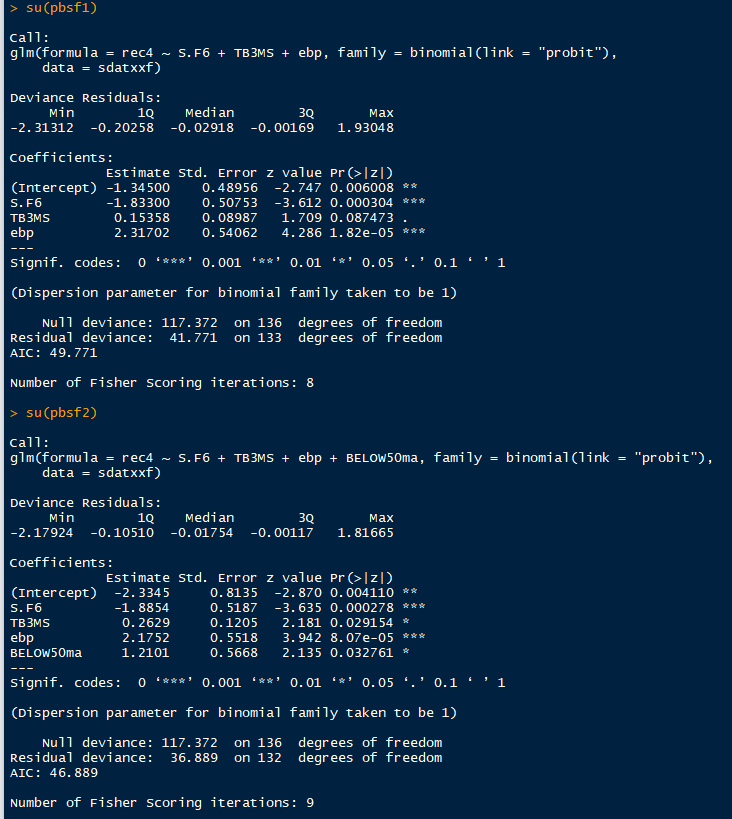
Additional Model Details
Below I have included summary data for the probit models for Fed Mod and BWV Mod.