Ten year treasury rates have spiked in recent days and stand at 3.22%. This is the highest level since 2011. Last month the Federal Reserve raised rates for the third time this year. Chairman Powell said in an interview last week with PBS, “Interest rates are still accommodative, but we’re gradually moving to a place where they will be neutral.” He added, “We may go past neutral, but we’re a long way from neutral at this point, probably.”
Meanwhile, the unemployment rate fell to 3.7%. The lowest we have seen in about 50 years. Non-farm payrolls for August were adjusted up substantially.
The combination of a strong jobs report and the comment by Powell about future rates hike look to have been the catalyst for the latest jump.
Stock Market Stumbles
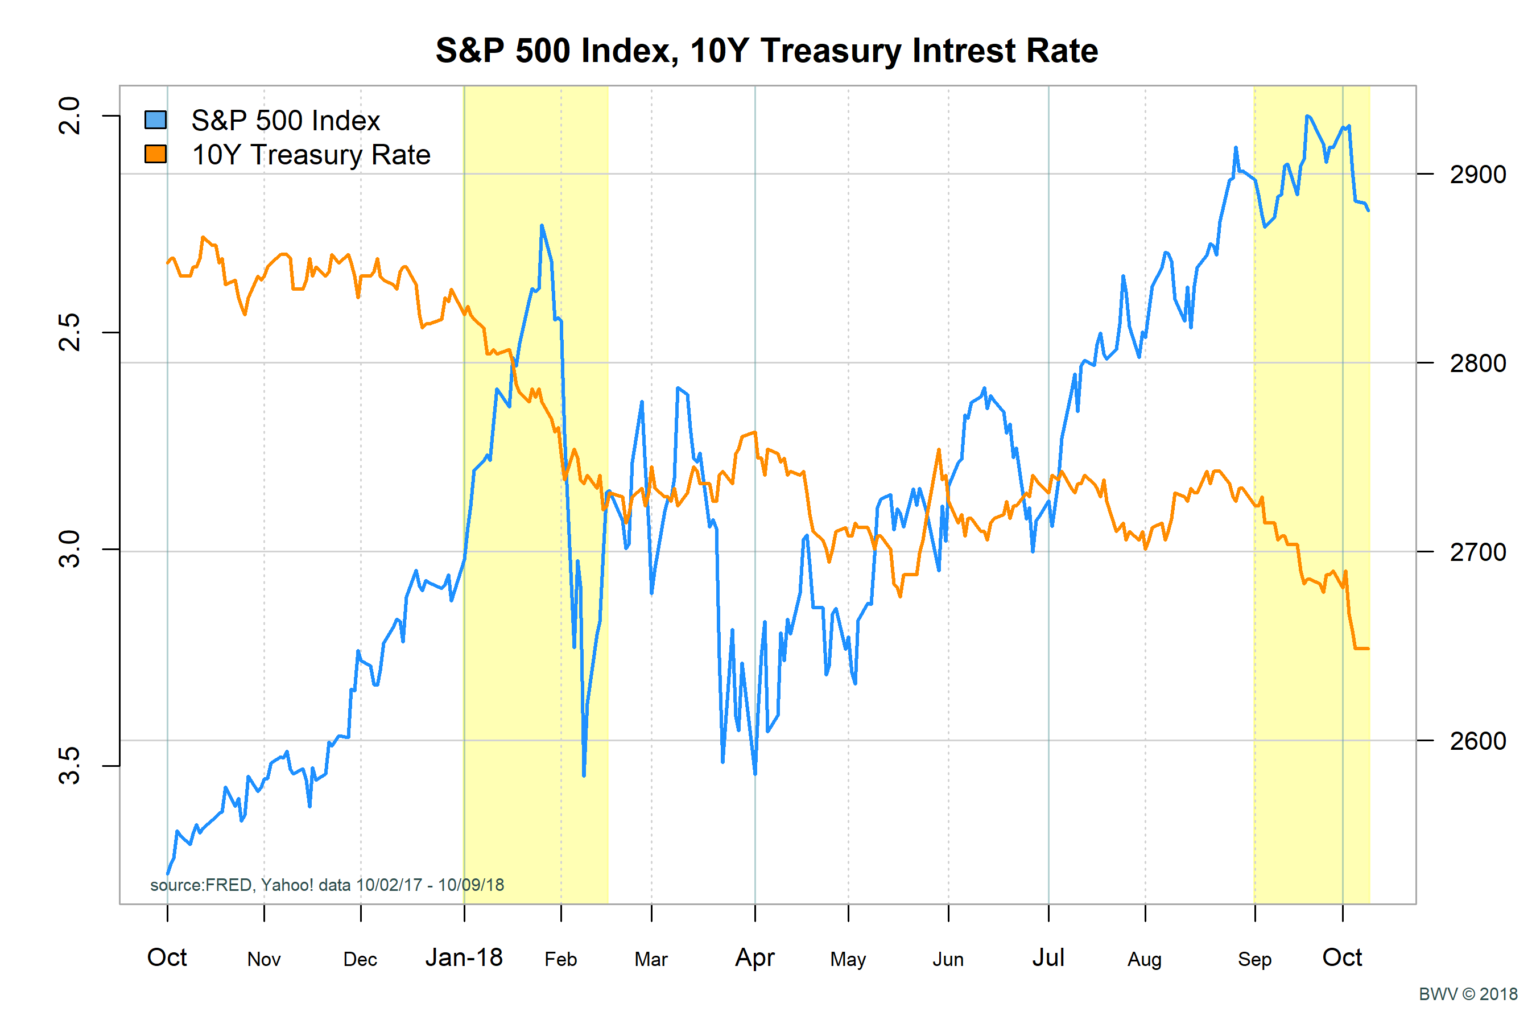
As we have discussed, the stock market really doesn’t like higher interest rates. Interest rates are the denominator in valuing stocks. The chart for the S&P 500 for 2018 shows the relationship clearly. In the above chart, I have plotted the S&P 500 index, along with the inverse plot of 10 year Treasury Bonds. I have highlighted the two regions this year where we have seen large shifts up in the interest rates. We can see from the chart, that for 2018, the sharp jumps in interest rates have led to market volatility and declines.
Analysis
It’s difficult to forecast and time these things precisely. The IMF World Outlook came out this week and cut projections for US growth for next year. The forecast for 2018 is 2.9% and the forecast for next year is 2.5%. They cite headwinds due to tariff talks along with the impact of US deficit spending. Although there is significant debate among economist, the consensus is that high government debt to GDP (over 90%) has been show to impact growth down by 2%. Also, interest rates are higher for countries with large deficits.
There are signs that the economy may actually decelerate in the coming quarters. According to Pimco, we see signs of this with deceleration in housing, automobiles and equipment. One interesting phenomenon that may be at play is that the threat of tariffs may have actually caused a short term spike in growth. I was out with a friend who works in the flooring business and he said they are seeing very strong sales as they increase surcharges for tariffs from goods coming from China. Customers over the last quarter accelerated purchases to avoid price increases. This is just one data point, but economists are looking at this ‘pull forward’ effect as one of the things that explains recent boosts in the economy.
The Bottom Line
If we could forecast future interest rates with any certainty, life would be grand. For now, let’s go with the IMF forecast for 2.5% real growth next year in the US. If interest rates tend toward the nominal GDP and inflation stays at 2.2%, we would have a target of 4.7% on treasuries. This is before accounting for the huge distortion created by central banks for easy money. How much of a drag is the central bank policy? It’s really hard to say. Let’s just say 1 -1.5% drag. In this case, we’d expect to see the 10 year go from 3.2% to 3.7%. This is a pretty large range. If the economy does decelerate and global growth slows, then the 3.2% current rate may find some stability. If the economy takes another leg up in growth we could see the 3.5-3.7%. My personal belief is that we are going to land closer to 3.25 – 3.5% in the next 12 months. That said, there is downside potential if the rates climb above 3.5%. For this reason, we remain neutral for weight on equities.