Given recent events in the financial markets such as Fed rate hikes and weakness in oil prices, we are seeing increased volatility in certain bond sectors. In this piece, I’ll review recent performance and future outlook with an emphasis on bond funds we hold in Brightwood Ventures model portfolios.
Recent Performance
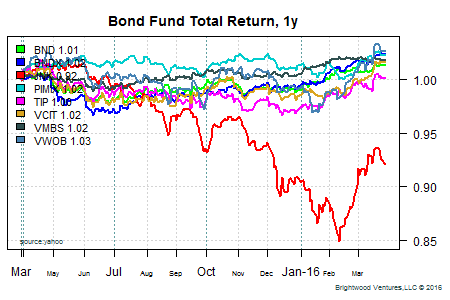 Bond sectors vary greatly in terms of their risks and returns and how they react to economic events. The figure on the right shows total returns for a select set of bond funds. Each of these funds is exposed to one or more bond subsectors. Let’s start by looking at the Vanguard Total Bond Market ETF (symbol: ‘BND’). This fund tracks the Barclay’s US Aggregate Bond index. The index is a market-cap weighted representation of US bonds. The index excludes high-yield (below investment grade US bonds) and treasury inflation protected securities. Over the past year, the total return for BND is 1.55%.
Treasury inflation protected securities are bonds issued by the US government. The bond face value is adjusted over time based on changes in the CPI (Consumer Price Index). Where other bonds pay a nominal rate, TIPs are paying interest based on real returns (i.e. adjusted for inflation). Lately, inflation expectations have started to rise and we can see this reflected in the price of TIPs. Total return for the iShares TIPs etf has been essentially zero in the last 12 months.
High-yield bond funds hold corporate bonds that are below investment grade (lower than ‘BBB’ rating). Generally, companies with a weak financial condition have greater risk of defaulting. These companies pay a higher rate of return on their debt. SPDR® Barclays High Yield Bond ETF (symbol: JNK) is example of a bond fund which provides broad exposure to high-yield debt. In the past year, total return for the JNK high-yield debt has fallen 7.7%. Looking at the total return graph, we can see that high-yield funds substantially underperformed in the second half of 2015. The two primary reasons for this were severe weakness in the oil prices and concerns that rising Fed funds rates are signaling that we are entering into the late stages of the business cycle with tightening credit. With rising interest rates and weak commodity prices there is a good deal of concern that we will see an increasing number of defaults.
International bonds are issued by foreign governments (sovereign debt) as well as corporations. Furthermore, we can break down debt issued by developed countries vs. emerging markets. Vanguard’s Total International Bond Fund (symbol: BNDX) holds corporate and sovereign bonds issued by both developed and emerging countries outside of the US. Vanguard’s Emerging Market Bond Government Bond Fund (symbol: VWOB) holds government and corporate debt issues in emerging countries. Approximately 30% of the VWOB is below investment grade (high-yield) debt. The two funds noted here are denominated in US dollars. It is also possible to get bond and bond funds denominated in the local currency.
Pimco’s Income Fund (symbol: PIMIX) is an example of a multi-sector bond fund. This fund is actively managed, varying weights on sectors based on the fund manager’s outlook. Over the past 12 months, PIMIX has returned 2.28% or .73% greater return than the US aggregate bond etf BND. Based on long term performance, we are weighting model portfolios to hold approximately 50% of bond asset allocation in actively managed funds such as Pimco’s PIMIX.
Current Yield and Outlook
 As prices for the bond sectors change over time, the relative value also changes. For example, the large decrease in the price of high-yield bond prices means that the current yield has risen. At some point, the change is substantial enough for us to consider changes in tactical weighting. In addition, as noted above, we rely on the expertise of active bond managers such as Pimco to make these changes.
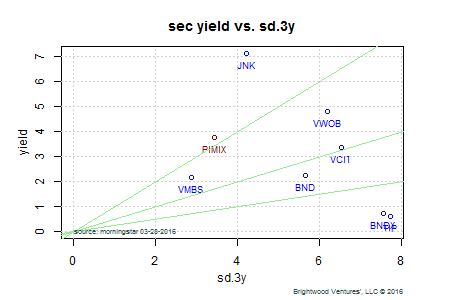
One of my favorite tools for understanding the relative attractiveness of bond sectors is the SEC yield plotted against the most recent 3 year standard deviation. The SEC yield is based on the most recent 30 days interest yield for the fund (interest payment divided by recent price). The chart at the right plots the sec yield vs. sd.3y. One note of caution is warranted. We are using the 3year standard deviation of monthly returns as a proxy for risk. There is no assurance that the future standard deviation will follow the recent history. In particular, for high-yield and foreign debt these measures can change very quickly.
Generally funds with the higher yield with lower risk are preferred. We can see from the graph that the high-yield fund, JNK, has an SEC yield over 7%. As of the start of 2016, JNK was approximately 17% weighted in the energy sector. Recent volatility has been higher than the 3yr standard deviation and additional volatility may be expected.
How are we currently positioned? We hold PIMIX, VWOB and BND in our core model portfolios at this time. We included BNDX in the graph as this fund is included in Vanguard model portfolios we use as a benchmark. We included TIPS in the graph given the unique structure to provide real return vs. nominal returns. Based on historical performance we are comfortable with Pimco’s ability to actively manage exposure to various sectors, including high-yield. We continue to hold VWOB to give us targeted exposure to emerging market sovereign debt based on our view that the sector is relatively more attractive than the overall international developed market bonds as measured by the risk-adjusted SEC yield. VWOB has posted a return of 3.39% over the past 12 months. Although past performance does not assure future returns, based on our expectations and the current SEC yield to risk ratios believe we are well positioned. Given the higher allocation to government bonds in the BND etf, we believe our overall bond allocation should provide returns in excess of the US Aggregate bond index with similar overall risk.