• We use fundamental analysis to measure relative attractiveness
• The US utilities and consumer staples sectors look expensive
• US value stocks and the financial sector look relatively cheap
• Emerging market equities continue to look like very cheap relative their growth
Valuation Method
The method used here is based on fundamental analysis. We are using the projected growth in earnings for each of the selected funds. This information comes from Morningstar Research. We cut their growth forecasts in half. The reason for this is that the projections are based on analyst estimates that tend to be overly optimistic.
To decide where the relative value is, we make some assumptions. First, assume that the S&P 500 is correctly valued. We use this to calculate the required return for the market based on the current PE level. We find that the required return implied using a simple constant earnings growth model. Currently, the implied required return rate is 11.5%. This is not a prediction of future returns, this is the required return one is pricing at, if the estimated growth rate is received in perpetuity.
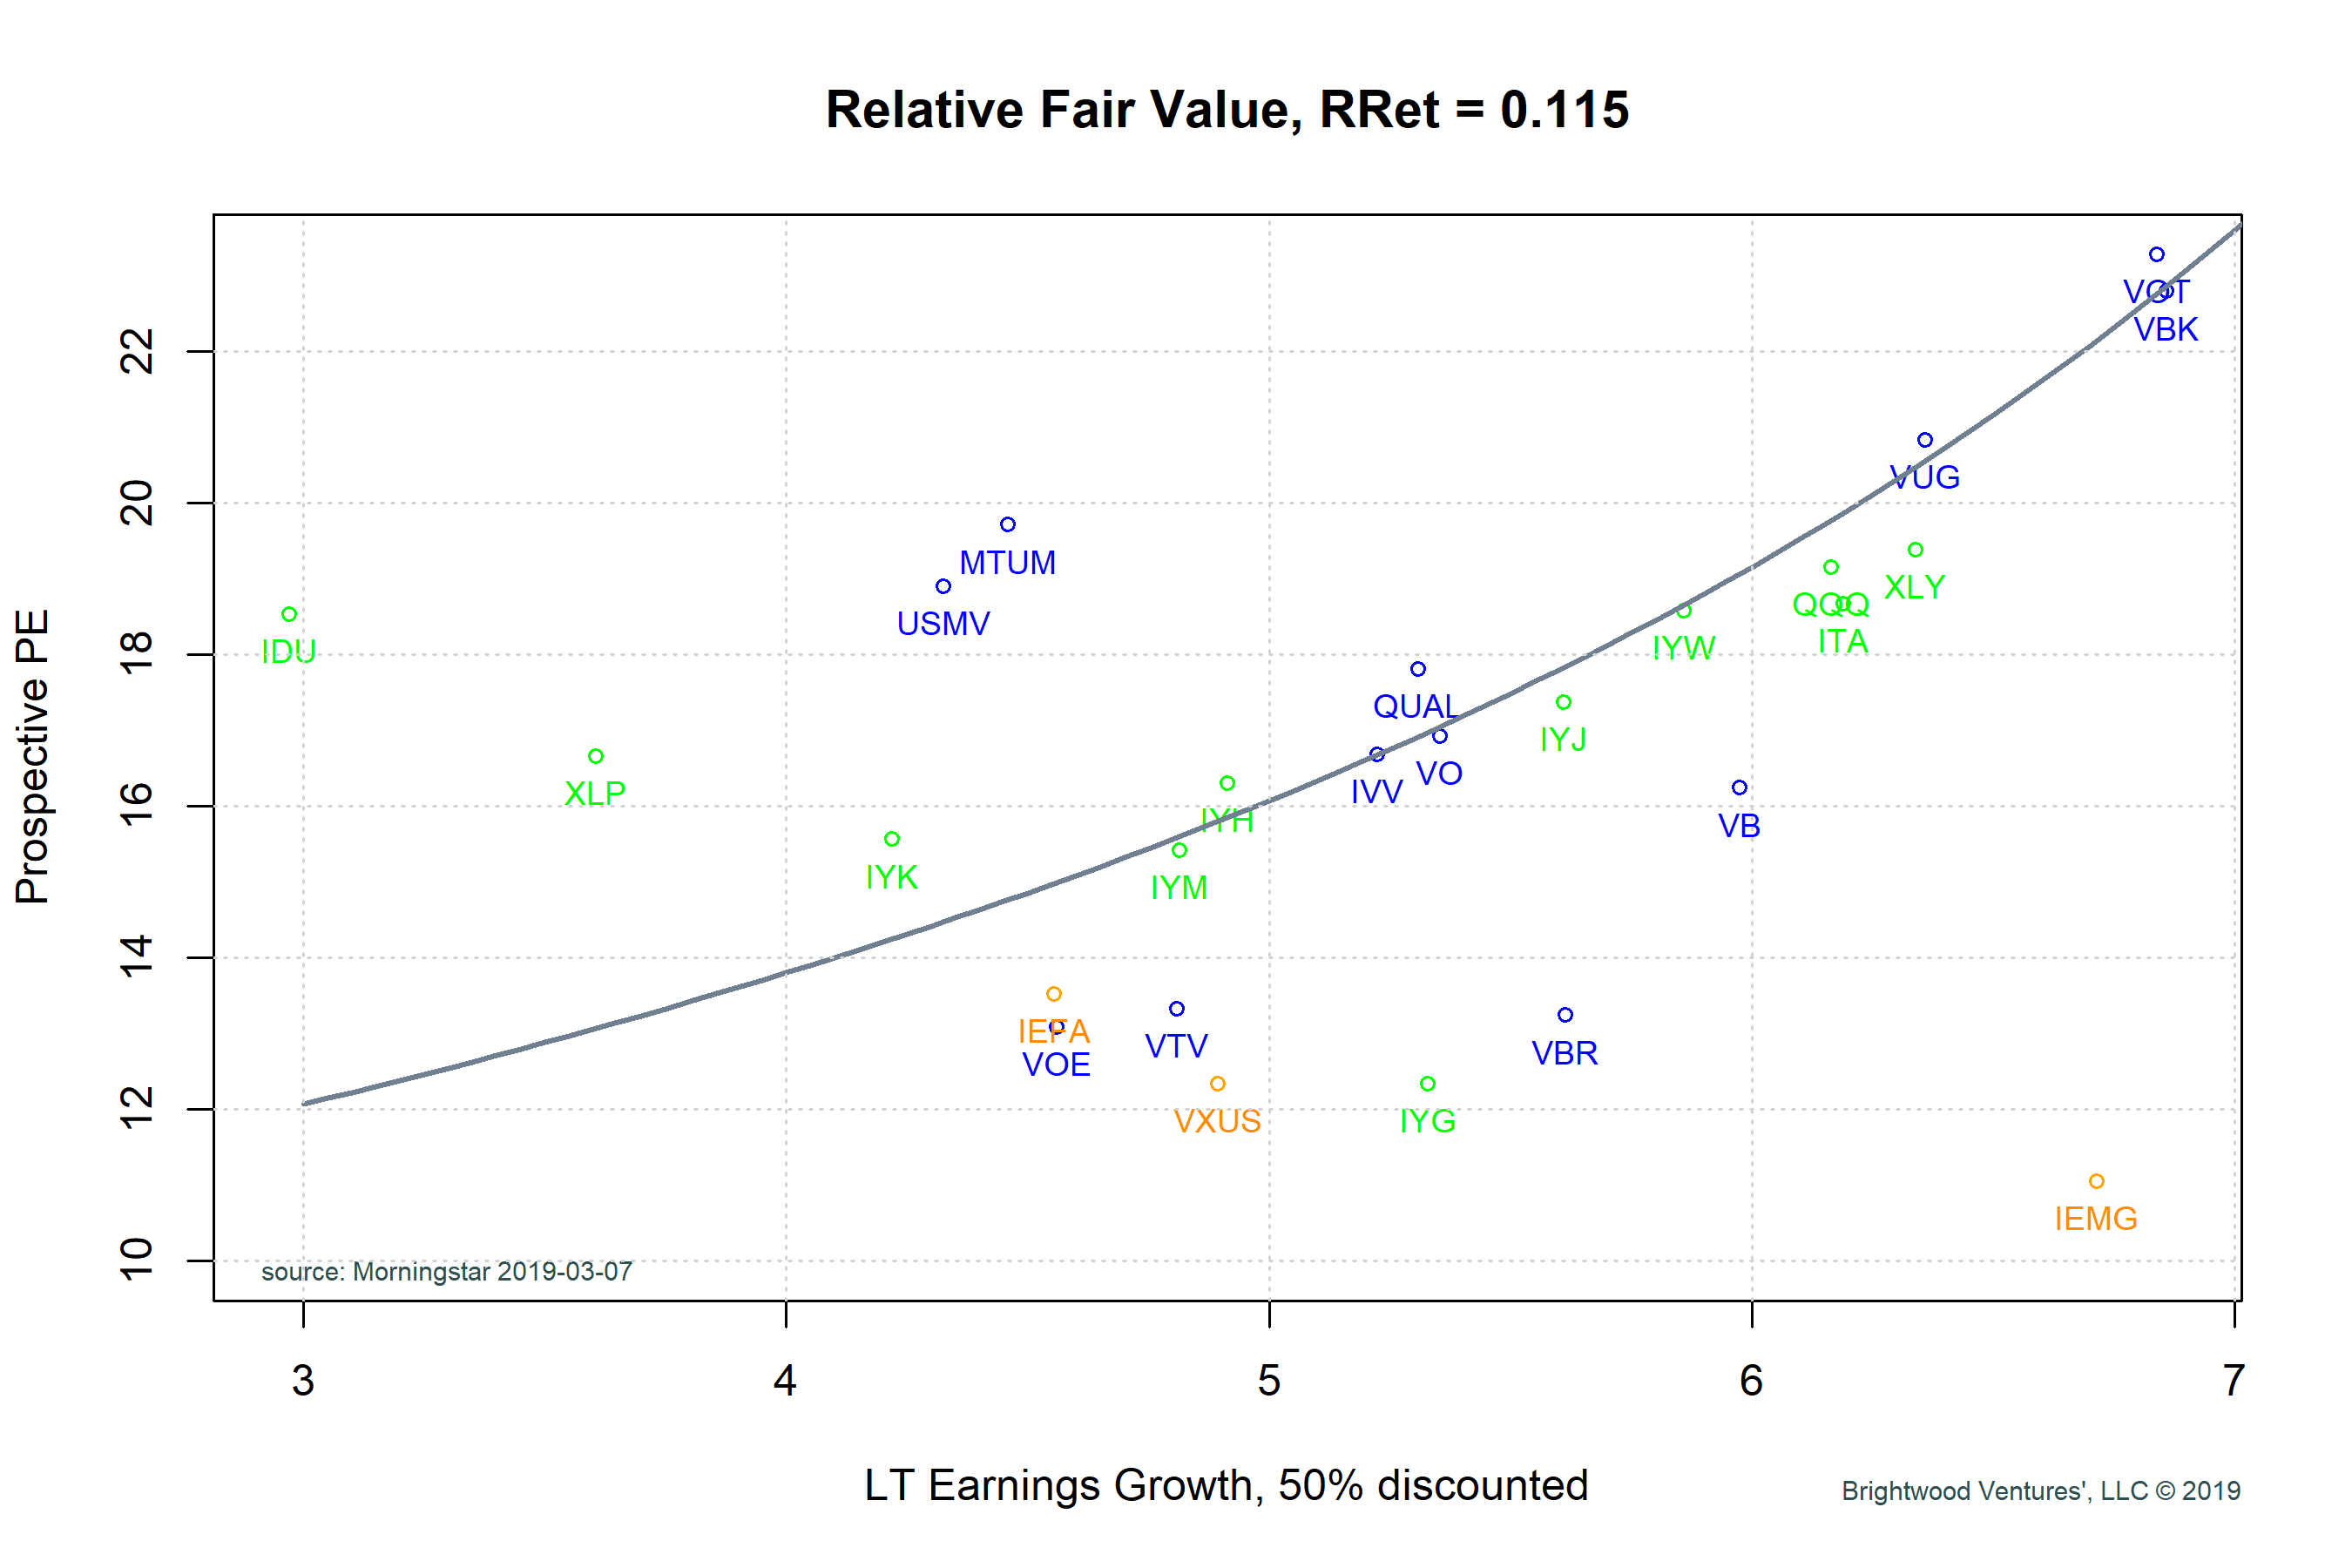
Next, given the required return rate, we plot a black line that represents the ‘fair’ PE one would be willing to pay, given a range of growth expectations. Finally, we plot various ETF funds based on their estimated future earnings and prospective PE currently. Any fund which plots above and to the left of the curve is considered ‘over-priced’. Any fund which appears below and to the right of the curve is considered ‘under-priced’. Note the color coding, funds plotted in green are US sector funds, while funds plotted in blue are US factor funds. Finally, funds that are plotted in orange are international equity funds.

Observations
Note that the fund dots do tend to cluster around the black ‘fair value’ line. We can see that while there is quite a bit of variation, that generally higher PE levels tend to align with higher growth expectations.
It is interesting to note also that the price to prospective PE ratio for the S&P 500 is just below 17 at 16.7. This is well below where it was at the beginning of 2018. The US Equity market valuation based on this model has improved, given last year’s weak performance and continued growth in earnings.
Which Sectors are Over-priced?
From the graph we see that the symbols ‘IDU’,’XLP’, ‘USMV’ and ‘MTUM’ are above the curve. IDU is iShares Utilities ETF. XLP is the SPDR Consumer Staples fund. USMV is the iShares USA MSCI minimum volatility fund and MTUM is the iShares USA MSCI momentum factor fund.
What could explain this? With the latest market volatility in Q4, there has been a flight to more defensive sectors. Utility stocks are considered a safe haven when market volatility is high. Consumer defensive stocks like Proctor & Gamble Co, PepsiCo and Walmart are also considered safer especially when the economy slows. USMV weights stocks with the least amount of volatility and so it is heavily weighted toward utilities and defensive sectors. Momentum stocks are those stocks that have seen the most recent price appreciate. Currently, Healthcare is the most heavily weighted sector in momentum stocks. Once again, certain sub-segments of the healthcare sector tend to be safer when the economy declines.
What does it mean? Investors are fearful and are currently willing to pay up for safer stocks. The market seems to be pricing in a slower economy.
Which sectors look cheap? Starting with US funds, we see that the blue funds, VOE, VTV, VBR and VB are all below the line. These funds include large-, mid- and small- cap value funds as well as mid-cap stocks generally. Currently, financials and cyclical stocks tend to make up the highest weightings in the value segment. Value stocks sound safe but there is a reason value stocks are priced low. Generally, these companies have some kind of problem. It could be slow growth, high debt an/or poor operating results. Historically what we see is that value stocks get hurt badly when the stock market falls. They can outperform the market when a market recovery arrives.
With the recent drops in the stock market in Q4, value stocks which were already depressed, took a big hit. Again, this suggesting a flight toward safety.
Finally, let’s discuss international stocks. International economic growth has slowed for developed countries. The orange fund ‘IEFA’ is iShares MSCI developed country fund ETF. Germany, France, UK and Japan are heavily weighted in the IEFA fund. Forecast growth for companies in this fund are well below the growth expectations in the US. Meanwhile, IEFA the iShares emerging market fund includes companies in emerging markets like China, Taiwan, S Korea. The companies in this group are weighted much more toward technology and are higher risk.
Conclusion
From the discussion we can see a bit of a disconnect between investor sentiment and analyst growth projections. If analysts are correct and the world economy does continue to grow, we would expect that the defensive sectors could correct and under-perform while emerging markets could recovery and deliver good performance. It is possible that investors became too fearful and moved too heavily into defensive equity sectors.