• As I write this, the S&P 500 index is trading at 2631.
• The S&P 500 has risen ~11% since the December 24th low.
• Based on prior levels, we are approaching a resistance level.
• Expect volatility to continue but focus on earnings and economic data for direction.
Technical analysis refers to using past prices and volume to get an idea of where the stock market may be headed. I tend to prefer fundamental analysis (for example, determining a fair value for stocks based on earnings and interest rates) over technical analysis. That said, I concede that there is some information contained in technical analysis. I believe that when prices are uncertain, past levels do form a psychological reference point. In addition, signals such as moving averages may cause investors to buy and sell. If enough people follow a particular signal, then the signal may become reinforcing.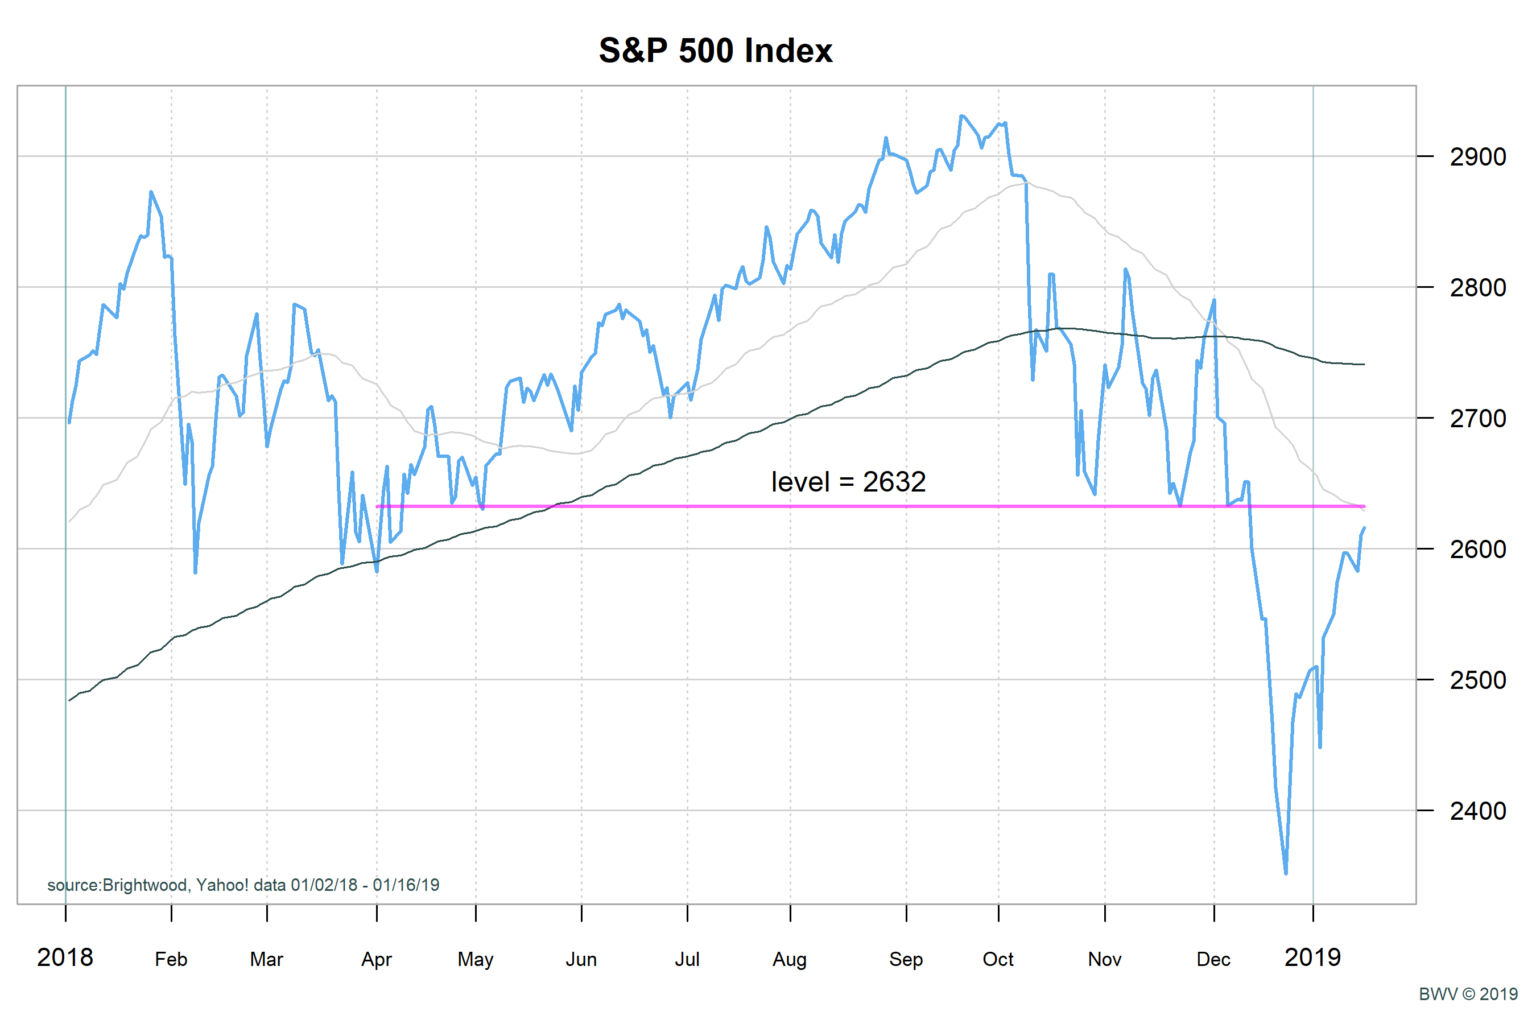
Let’s explore this type of analysis using the chart of the day. This is a chart of the S&P 500 stock index. I have added a few additional lines to help illustrate the points. First note the two grey lines. These are the 50-day and 200-day moving average for the S&P 500. The light grey line is the 50-day moving average and the dark grey is the 200-day moving average. One of the signals technicians look at for buying and selling is the point where the 50-day and 200-day signals cross. When the 50-day falls below the 200-day, a sell signal is generated. Conversely, when the 50-day moves above the 200-day a buy signal is given. Historically, the largest drops have occurred during these ‘sell’ periods. Notice below how the market dropped very rapidly from the point where the cross occurred. One reason to be skeptical of signals such as these is that it can be very difficult to trade based on the signals.
Next let’s talk about support and resistance. There is some evidence to suggest that when the market hits a level and bounces off the level, some amount of support is demonstrated. The idea is that when the market approaches the level, buyers step to purchase and the prices rise. The magenta line represents such a level at 3632. From the chart, we can see that when the S&P 500 price approached this level in early May, November and early December, the price reversed and went higher. This support seemed to work well, until mid-December where the price dropped rapidly.
Many market watchers were surprised that the market dropped below the support level. Buyers quit buying, market liquidity was very low and volatility spiked. What caused the large decline? We can’t say with certainty. The hawkish stance of the Federal Reserve regarding interest rate hikes and trade tensions were all noted.
I highlight this chart to make a few points. First, technical analysis can produce competing signals. On one hand, there was supposed to be support at 2632 in December. At the same time, the 50-day fell below the 200-day price. The support at 2632 should have predicted some kind of recovery, while the 50-200 cross would suggest that selling pressure would mount. This is one of the problems with technical analysis. You don’t always get clear signals
Where Do We Stand?
It is said that once support is broken, that level becomes resistance. We are now at or approaching the 2632 level from below. I would expect that we will continue to see uncertainty (volatility) over the coming weeks.
According to Morningstar data, the S&P 500 is trading at a forward PE of 14.35. This is approximately a 7% earnings yield. The earning yield is about 4.25% above the 10Y treasury rate of 2.75%. Based on fundamentals, if the economy continues steady growth we should be in good shape. The US economy is growing but the growth may decelerate back to 2% real. We continue to watch the earnings results very closely along with leading indicators. Slow and steady wins the race!