
In the first part of this article we covered macroeconomic conditions and asset class return projections for equities. In this article we will discuss fixed income as an asset class and then move to a discussion of asset allocation and portfolio construction.
Fixed Income
Central banks have driven interest rates down across the globe. Interest rates for short and intermediate term treasuries are generating essential zero real return. On the bright side, spreads for US corporate debt, high yield and certain other sectors such as asset backed securities provide somewhat more attractive yield. Foreign sovereign debt spreads have come down from last year, but still look to be a reasonable addition in fixed income allocation.
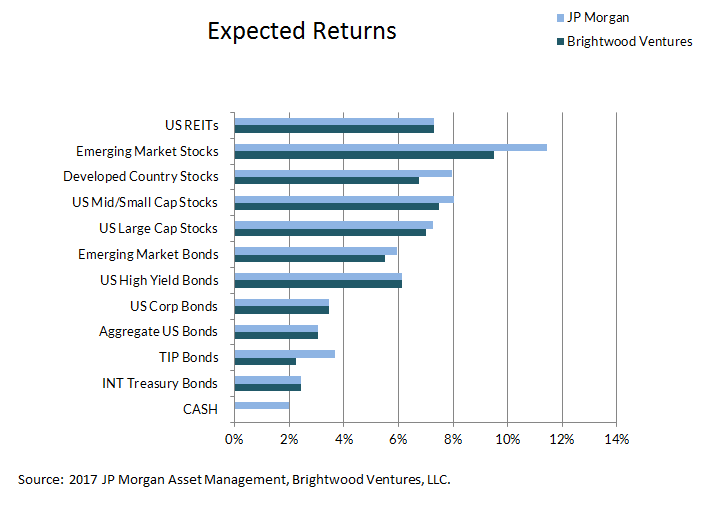
Once again the asset risk return expectations follow.
Asset Allocation
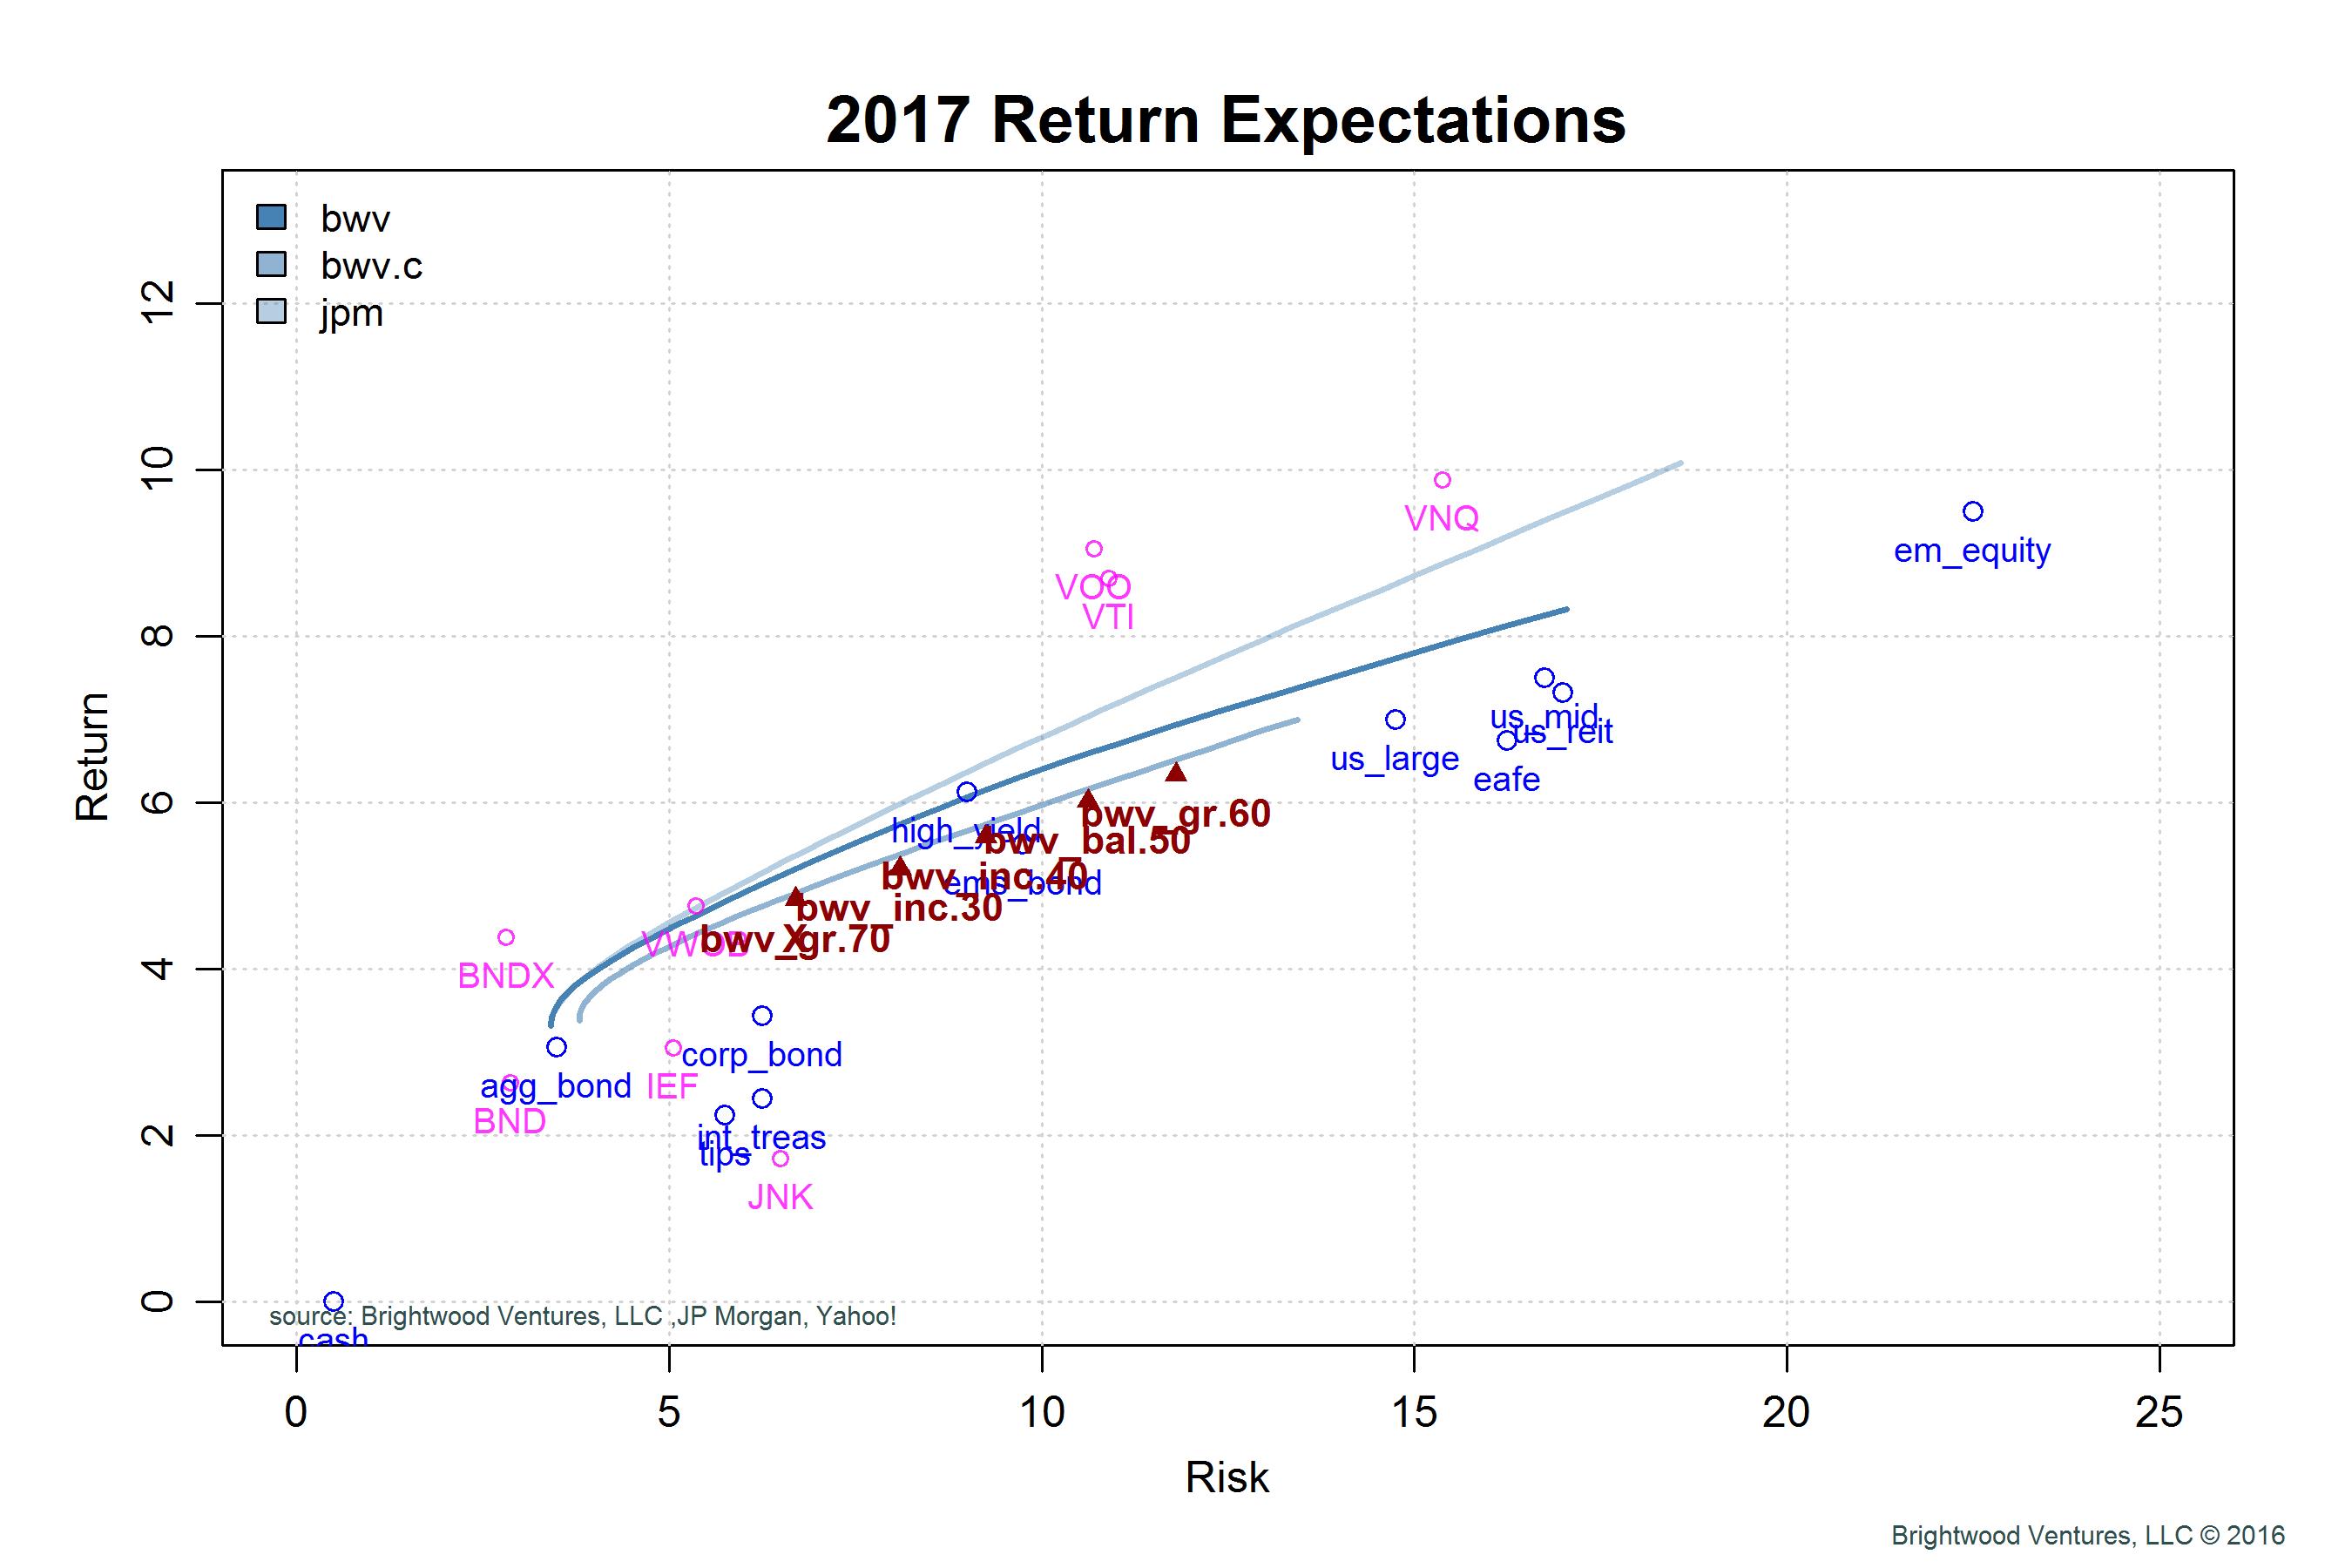
Once we have defined our expectations for various asset classes we move to generating portfolios from these assets. To create an ‘efficient’ frontier simply means to find the right combination of assets that will yield the best return at a given level of risk. These portfolios are called ‘efficient’ because they are said to dominate all other combinations of assets that generate the target level of risk.
One final point to note regarding the line denoting the efficient frontier, we notice that the line is not straight, but has a curve to it. This curve comes from the fact that assets do not move in unison. The price movement of one asset relative to another, call correlation is a way to describe diversification benefit. Take for example, US aggregate bonds vs. US large cap stocks. The correlation between these two assets classes is essential zero. This means that when bonds are up, stocks could be up or down. By combining assets which are not highly correlated with each other we get some return benefit, relative to a target risk level.
Efficient Portfolios
The goal for creating portfolios along the efficient frontier is to construct portfolios that meet a specific risk or return target. In the method that I use, I also look to measure the percentage of equities or risky assets in the portfolio. It is also important to point out that constructing portfolios can lead to some strange results where a large % of assets are held in one asset class.
To address these issues I use constraints to ensure that assets are not excessively weighted. In addition, I use a method called ‘resampling’. The process of resampling helps to generate efficient portfolios with smoother asset mixes across the spectrum. These are details that go beyond a simple introduction, but for those interested in details of the programming model I generated please feel free to contact me with questions.
Brightwood Ventures Model Portfolio Allocations
In the following chart, I include 5 portfolios with equity allocations ranging from 30% equity (Income 30) to 70% equity (Growth 30). These portfolios are very close to the efficient frontier line. They are not exactly on the line given that the portfolios have been adjusted to limit asset percentages that are below the constraints used to generate the ‘efficient line’. Judgment is required.
Discussion
Now that we have talked about the process, let’s take a closer look at the results by focusing on the Brightwood Growth 60 portfolio.
The growth portfolio noted as ‘bwv_gr_60’ on the chart is expected to generate an average return of 6% with a standard deviation of 11%. The numbers generated come from the expected asset class returns and correlations among assets. This 6% return is below historical averages, but given the low growth / low interest rate environment we found ourselves in this is not a surprise.
How does this compare to industry views?
The 60/40% return I estimated is very close to estimates used by JP Morgan and Research Affiliates. GMO, on the other hand, holds the view that interest rates will rise and PE levels will return to historical averages. If that is the case, they expect near zero real returns from stocks (2% nominal return) as prices fall to align with lower PEs.
At the same time, while pension funds have gradually been lowering their estimated future returns, most of the pension funds I have reviewed are expecting long term returns in the 7 – 7.5% range. State pensions are very slow to change return expectations and seem to place too much weight on historical returns. Low population growth, low productivity gains and low interest rates don’t look like they will change anytime soon. As such, I believe the moderate outlook we hold is the prudent one.
How can this information be used for retirement planning? We use the model portfolios along with client personal financial plans to project their retirement into the future. Given the client goals and expected returns we model the likelihood a plan will succeed. If you have additional question about this article or your retirement plan please get in touch with us.